This page provides examples of public Coronavirus data you can download to Excel with Power Query. Each example has a link, a screenshot to show what the data looks like in Excel after being imported, and an Excel workbook.
The attached Excel workbooks include a working query, and each query returns data to an Excel Table. You can refresh the data by right-clicking in the table and selecting «Refresh». When data has changed, you will see more recent data appear.
If you’re new to Power Query, this article explains how to build a single query in more detail.
Requirements
This project depends on Power Query, so you’ll need Excel 2013 or later on Windows. On a Mac, you can refresh queries with Office 365 Excel, but you can’t yet edit or create queries.
Sample Coronavirus Data
The purpose of this article is to show examples of how to get Coronavirus testing data into Excel. I can’t vouch for the quality of the data. The links below provide more information about each website. The COVID Tracking Project provides a grade for each state.
Excel workbooks are attached below the descriptions. To download fresh data, right-click inside the table and select «Refresh».
To inspect or edit a query, click Queries and Connections on the Data tab of the ribbon, then double-click on the query. This article explains how to build a single query in more detail.
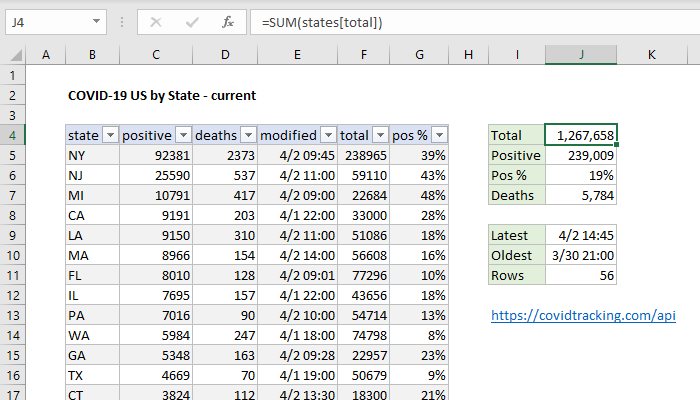
United States — current
Source: COVID Tracking Project (https://covidtracking.com/api)
This data contains the latest snapshot of Coronavirus testing data for the United States at the state level. It contains current totals only, not historical data. This page describes in detail how the query was created.
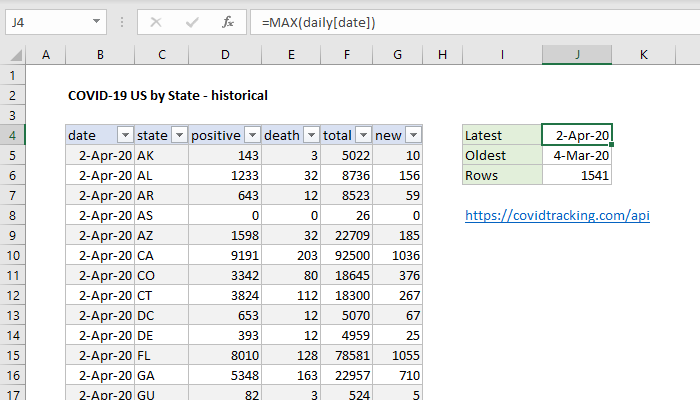
United States — historical
Source: COVID Tracking Project (https://covidtracking.com/api)
This data contains historical Coronavirus testing data for the United States at the state level. Each row in the data has a date.
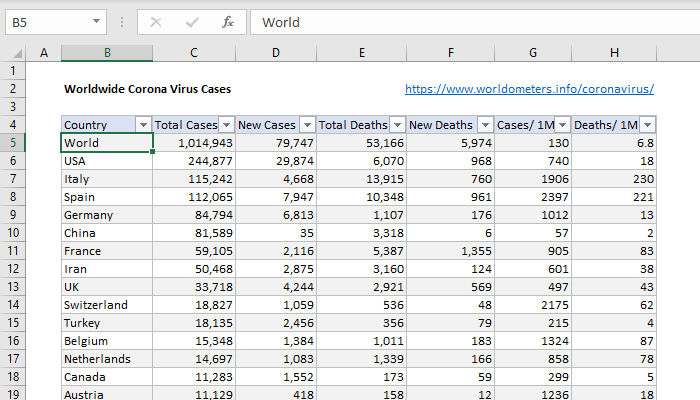
Worldwide — current
Source: Worldometers (https://www.worldometers.info/coronavirus/)
This is an example of data retrieved directly from a table on a web page. In general, a web page is not as reliable as a data file, since the structure of a web page is more complex and might change.
Note: you’ll get an expression error if you try to refresh on a Mac. Power Query on Mac does not support web sources yet.
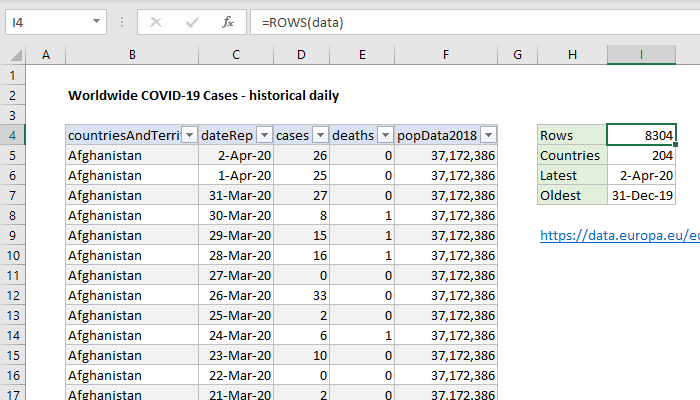
Worldwide — historical
Source: EU Open Data Portal (https://data.europa.eu/euodp/en/data/dataset/covid-19-coronavirus-data)
This example shows how you can connect directly to an Excel workbook. Data Europa has a JSON api as well. Data is by country by day, and would be a good candidate for a Pivot Table to provide totals.
МАЙ 2020
Мы решили выложить данные по коронавирусу по регионам РФ в табличной форме (Excel) для тех, кто хочет попробовать себя в аналитике.
Источник по заболевшим: Роспотребнадзор
Новый коронавирус был назван тяжелым острым респираторным синдромом “Коронавирус 2” (SARS-CoV-2), в то время как заболевание, связанное с ним, теперь называется COVID-19. С 6 марта 2020 года, когда началась пандемия коронавируса в Российской Федерации, группа аналитиков компании “Полиматика” собирает данные о количестве случаев COVID-19 на основе публичных ежедневных отчетов Федеральной службы по надзору в сфере защиты прав потребителей и благополучия человека (Роспотребнадзор). Для обеспечения точности и достоверности данных этот процесс постоянно совершенствуется. Датасет помогает отслеживать и интерпретировать актуальную динамику пандемии COVID-19 в Российской Федерации. Корректировка данных Роспотребнадзором не учитывались; это может вызвать незначительные расхождения при сравнении с данными, предоставляемыми нарастающим итогом.
СТРУКТУРА ДАННЫХ
Регион
Федеральный округ
Дата — начинается с 06.03.2020
Случаи заболевания — количество новых случаев на дату
Население — население регионов РФ на 01.01.2020. Источник
Количество смертей — количество смертей дату Источник
ДАТА ОБНОВЛЕНИЯ: 30 ИЮНЯ
СКАЧАТЬ ДАТАСЕТ
НАШИ ВИДЕО С АНАЛИТИКОЙ ПО КОРОНАВИРУСУ
Stats Analysis
Pull-in New Columns with Query Refresh
Coronavirus Resource Center
Coronavirus COVID-19 Map
Raw Data from GitHub
This week I’ll show you how to import into Excel daily updated, location specific, data on Coronavirus covid 19 infections, deaths, and recoveries and simple and useful techniques to analyze that data.
The data that we will use comes from the Johns Hopkins University and it compiled from a list of sources that can be found on the Raw Data link at the top of this description section.
Specifically, I’ll show you:
- how to download and import coronavirus stats into Excel using a csv file
- how to directly download coronavirus stats that are updated daily
- how to clean the imported data
- how to analyze the imported covid-19 stats
- how to plot the data on a dynamic chart
This is a tough time for many of us and I hope that this tutorial can help someone out there!
Please try to stay safe!

Excel VBA Course — From Beginner to Expert
200+ Video Lessons
50+ Hours of Instruction
200+ Excel Guides
Become a master of VBA and Macros in Excel and learn how to automate all of your tasks in Excel with this online course. (No VBA experience required.)
View Course
Similar Content on TeachExcel
Slicer Power Analysis in Excel — Pivot Tables + Pivot Charts + Tables + Slicers
Tutorial:
Powerful Excel data visualization and analysis that uses a combination of techniques, whi…
Pivot Chart Formatting Copy Trick in Excel — Excel Quickie
Tutorial:
Easily copy Pivot Chart formatting from one Pivot Chart to another Pivot Chart in Excel.
…
Filter Data to Show the Bottom 10 Percent of a Data Set in Excel — AutoFilter
Macro: This free Excel macro filters a data set to display the bottom 10 percent of the data set …
How to Create and Manage a Chart in Excel
Tutorial: In this tutorial I am going to introduce you to creating and managing charts in Excel. Bef…
Enable the Analysis ToolPak in Excel
Tutorial: How to enable the Analysis ToolPak in Excel.
This is an add-in program that comes with Exc…
Easily Compare Duplicate Values in Excel
Tutorial: Here, I’ll show you a simple technique to quickly and easily compare large lists of duplic…
Subscribe for Weekly Tutorials
BONUS: subscribe now to download our Top Tutorials Ebook!

Excel VBA Course — From Beginner to Expert
200+ Video Lessons
50+ Hours of Video
200+ Excel Guides
Become a master of VBA and Macros in Excel and learn how to automate all of your tasks in Excel with this online course. (No VBA experience required.)
View Course
Обновлена статистика коронавируса в России на 16 апреля 2023. Ниже, можно
узнать сколько заболевших и умерших за последние сутки — Россия.
Онлайн статистика заражения коронавирусом на сегодня, количество заболевших, выздоровлений и смертей
на 16 апреля 2023. Последние новости коронавируса в России.

22 765 337 +7094 Случаев заражения
216 355 +215 Активных случаев
397 828 +38 Погибших
22 151 154 +6841 Выздоровевших
1.75%
Летальность
97.30%
Восстановление
Коронавирус в России на 16 апреля 2023
По последним данным статистики оперативного штаба
на 16 апреля 2023 в России, лабораторно подтверждено —
22 765 337 случаев заражения коронавирусом COVID-19,
из них полностью выздоровели — 22 151 154 пациентов,
зафиксировано смертей от коронавируса — 397 828 человек.
По официальной статистике коронавируса в России, в период
с 15 по 16 апреля 2023 количество заболевших COVID-19 —
7 094,
выздоровлений — 6 841, смертей —
38.
Сколько заболело коронавирусом в России на 16 апреля 2023
В России подтверждено
7 094 новых случаев заражения
коронавирусной инфекцией, согласно статистике стопкоронавирус.рф.
Оперштаб напоминает о необходимости соблюдения домашнего режима горожанам старше 65 лет и с
хроническими заболеваниями.
Статистика коронавируса в России на 16 апреля 2023
22 758 243 Случая заражения
216 140 Активных случаев
397 790 Погибших
22 144 313 Выздоровевших
1.75%
Летальность
97.30%
Восстановление


