
Модуль openpyxl обеспечивает довольно гибкое управление стилями, относительно простую работу с ними. Стили в электронных таблицах XLSX используются для изменения внешнего вида данных при отображении на экране. Они также используются для определения форматирования чисел.
Содержание:
- Аспекты применения стилей модулем
openpyxl. - Cтили ячеек электронной таблицы.
- Создания нового стиля на основе другого.
- Цвета для шрифтов, фона, границ.
- Применение стилей.
- Горизонтальное и вертикальное выравнивание текста.
- Оформление границ ячеек.
- Заливка ячеек цветом и цвет текста.
- Именованные стили
NamedStyle.- Создание именованного стиля.
- Встроенные в Excel стили.
Аспекты применения стилей модулем openpyxl.
Стили могут быть применены к следующим аспектам:
font: устанавливает размер шрифта, цвет, стиль подчеркивания и т. д.fill: устанавливает шаблон или градиент цвета заливки ячейки.border: устанавливает стиль границы ячейки.alignment: устанавливает выравнивание ячейки.
Ниже приведены значения по умолчанию установленные модулем openpyxl:
from openpyxl.styles import (
                        PatternFill, Border, Side,
                        Alignment, Font, GradientFill
                        )

# СТИЛЬ ШРИФТА
font = Font(
        name='Calibri',
        size=11,
        bold=False,
        italic=False,
        vertAlign=None,
        underline='none',
        strike=False,
        color='FF000000'
            )

# ЗАЛИВКА ЯЧЕЕК
fill = PatternFill(fill_type=None, fgColor='FFFFFFFF')

# ГРАНИЦЫ ЯЧЕЕК
border = Border(
            left=Side(border_style=None, color='FF000000'),
            right=Side(border_style=None, color='FF000000'),
            top=Side(border_style=None, color='FF000000'),
            bottom=Side(border_style=None, color='FF000000'),
            diagonal=Side(border_style=None, color='FF000000'),
            diagonal_direction=0,
            outline=Side(border_style=None, color='FF000000'),
            vertical=Side(border_style=None, color='FF000000'),
            horizontal=Side(border_style=None, color='FF000000')
               )

# ВЫРАВНИВАНИЕ В ЯЧЕЙКАХ
alignment=Alignment(
                horizontal='general',
                vertical='bottom',
                text_rotation=0,
                wrap_text=False,
                shrink_to_fit=False,
                indent=0
                   )
Cтили ячеек электронной таблицы.
Существует два типа стилей: стили ячеек и именованные стили, также известные как шаблоны стилей.
Стили ячеек являются общими для объектов, и после того, как они были назначены, их нельзя изменить. Это предотвращает нежелательные побочные эффекты, такие как изменение стиля для большого количества ячеек при изменении только одной.
Например:
>>> from openpyxl.styles import colors
>>> from openpyxl.styles import Font, Color
>>> from openpyxl import Workbook
>>> wb = Workbook()
>>> ws = wb.active
>>> ws['A1'].value = 'Ячейка `A1`'
>>> ws['D4'].value = 'Ячейка `D4`'
# задаем стиль шрифта текста - цвет  ячейке
>>> ft = Font(color="FF0000")
# применяем стиль к ячейкам
>>> ws['A1'].font = ft
>>> ws['D4'].font = ft
# это изменение не сработает
>>> ws['D4'].font.italic = True
# Если необходимо изменить шрифт,
# то его необходимо переназначить новым стилем
ws['A1'].font = Font(color="FF0000", italic=True)
>>> wb.save('test.xlsx')
Создания нового стиля на основе другого.
Модуль openpyxl поддерживает копирование стилей.
Пример создания нового стиля на основе другого:
>>> from openpyxl.styles import Font
>>> from copy import copy
# задаем стиль
>>> ft1 = Font(name='Arial', size=14)
# копируем стиль
>>> ft2 = copy(ft1)
# а вот теперь на основе скопированного стиля
# можно создать новый, изменив атрибуты
>>> ft2.name = "Tahoma"
# имя шрифта первого стиля
>>> ft1.name
# 'Arial'

# имя шрифта нового стиля
>>> ft2.name
# 'Tahoma'

# размер остался как у первого
>>> ft2.size # copied from the
# 14.0
Цвета для шрифтов, фона, границ.
Цвета для шрифтов, фона, границ и т.д. Можно задать тремя способами: индексированный, aRGB или тема. Индексированные цвета являются устаревшей реализацией, и сами цвета зависят от индекса, предоставленного в рабочей книге или в приложении по умолчанию. Цвета темы полезны для дополнительных оттенков цветов, но также зависят от темы, присутствующей в рабочей книге. Поэтому рекомендуется использовать цвета aRGB.
Цвета aRGB.
Цвета RGB устанавливаются с использованием шестнадцатеричных значений красного, зеленого и синего.
>>> from openpyxl.styles import Font
>>> font = Font(color="FF0000")
Альфа-значение теоретически относится к прозрачности цвета, но это не относится к стилям ячеек. Значение по умолчанию 00 будет добавлено к любому простому значению RGB:
>>> from openpyxl.styles import Font
>>> font = Font(color="00FF00")
>>> font.color.rgb
# '0000FF00'
Применение стилей.
Стили применяются непосредственно к ячейкам.
>>> from openpyxl import Workbook
>>> from openpyxl.styles import Font, PatternFill
>>> wb = Workbook()
>>> ws = wb.active
>>> c = ws['A1']
>>> c.value = 'Ячейка `A1`'
>>> c.font = Font(size=12)
# можно напрямую
>>> ws['A2'].value = 'Ячейка `A2`'
>>> ws['A2'].font = Font(size=12, bold=True)
>>> wb.save('test.xlsx')
Стили также могут применяться к столбцам и строкам, но обратите внимание, что это относится только к ячейкам, созданным (в Excel) после закрытия файла. Если необходимо применить стили ко всем строкам и столбцам, то нужно применить стиль к каждой ячейке самостоятельно.
Это ограничение формата файла:
>>> col = ws.column_dimensions['A']
>>> col.font = Font(bold=True)
>>> row = ws.row_dimensions[1]
>>> row.font = Font(underline="single")
Горизонтальное и вертикальное выравнивание текста.
Горизонтальное и вертикальное выравнивание в ячейках выставляется атрибутом ячейки .alignment и классом Alignment().
Пример горизонтального выравнивания текста:
>>> from openpyxl import Workbook
>>> from openpyxl.styles import Alignment
>>> wb = Workbook()
>>> ws = wb.active
>>> ws['A1'].value = 1500
>>> ws['A2'].value = 1500
>>> ws['A3'].value = 1500
# выравниваем текст в ячейках стилями
>>> ws['A1'].alignment = Alignment(horizontal='left')
>>> ws['A2'].alignment = Alignment(horizontal='center')
>>> ws['A3'].alignment = Alignment(horizontal='right')
# сохраняем и смотрим что получилось
>>> wb.save('test.xlsx')
Вертикальное выравнивание в основном применяется когда изменена высота строки или были объединены несколько ячеек.
Пример вертикального выравнивания данных в ячейке:
>>> from openpyxl import Workbook
>>> from openpyxl.styles import Alignment
>>> wb = Workbook()
>>> ws = wb.active
# объединим ячейки в диапазоне `B2:E2`
>>> ws.merge_cells('B2:E2')
# в данном случае крайняя верхняя-левая ячейка это `B2`
>>> megre_cell = ws['B2']
# запишем в нее текст
>>> megre_cell.value = 'Объединенные ячейки `B2 : E2`'
# установить высоту строки
>>> ws.row_dimensions[2].height = 30
# установить ширину столбца
>>> ws.column_dimensions['B'].width = 40
# выравнивание текста
>>> megre_cell.alignment = Alignment(horizontal="center", vertical="center")
# сохраняем и смотрим что получилось
>>> wb.save("test.xlsx")
Оформление границ ячеек.
Цвет и стиль границ/бордюров ячеек выставляется атрибутом ячейки .border и классом Border() совместно с классом Side().
При этом аргумент стиля границ ячеек border_style может принимать ОДИН из следующих значений: ‘dashDotDot’, ‘medium’, ‘dotted’, ‘slantDashDot’, ‘thin’, ‘hair’, ‘mediumDashDotDot’, ‘dashDot’, ‘double’, ‘mediumDashed’, ‘dashed’, ‘mediumDashDot’ и ‘thick’.
Пример стилизации границ одной ячейки:
>>> from openpyxl import Workbook
>>> from openpyxl.styles import Border, Side
>>> wb = Workbook()
>>> ws = wb.active
>>> cell = ws['B2']
# установить высоту строки
>>> ws.row_dimensions[2].height = 30
# установить ширину столбца
>>> ws.column_dimensions['B'].width = 40
# определим стили сторон
>>> thins = Side(border_style="medium", color="0000ff")
>>> double = Side(border_style="dashDot", color="ff0000")
# рисуем границы
>>> cell.border = Border(top=double, bottom=double, left=thins, right=thins)
>>> wb.save("styled_border.xlsx")
Пример стилизации границ нескольких ячеек:
from openpyxl import Workbook
from openpyxl.styles import Border, Side

wb = Workbook()
ws = wb.active

# определим стили сторон
thins = Side(border_style="thin", color="0000ff")
double = Side(border_style="double", color="ff0000")

# начинаем заполнение области ячеек 10x10 данными
# при этом будем стилизировать границы области
for r, row in enumerate(range(5, 15), start=1):
    for c, col in enumerate(range(5, 15), start=1):
        # это значение, которое будем записывать в ячейку
        val_cell = r*c
        # левая верхняя ячейка
        if r == 1 and c == 1:
            ws.cell(row=row, column=col, value=val_cell).border = Border(top=double, left=thins)
        # правая верхняя ячейка
        elif r == 1 and c == 10:
            ws.cell(row=row, column=col, value=val_cell).border = Border(top=double, right=thins)
        # верхние ячейки
        if r == 1 and c != 1 and c != 10:
            ws.cell(row=row, column=col, value=val_cell).border = Border(top=double)
        # левая нижняя ячейка
        elif r == 10 and c == 1:
            ws.cell(row=row, column=col, value=val_cell).border = Border(bottom=double, left=thins)
        # правая нижняя ячейка
        elif r == 10 and c == 10:
            ws.cell(row=row, column=col, value=val_cell).border = Border(bottom=double, right=thins)
        # нижние ячейки
        elif r == 10 and c != 1 and c != 10:
            ws.cell(row=row, column=col, value=val_cell).border = Border(bottom=double)
        # левые ячейки
        elif c == 1 and r != 1 and r != 10:
            ws.cell(row=row, column=col, value=val_cell).border = Border(left=thins)
        # правые ячейки
        elif c == 10 and r != 1 and r != 10:
            ws.cell(row=row, column=col, value=val_cell).border = Border(right=thins)
        else:
            # здесь ячейки просто заполняются данными
            ws.cell(row=row, column=col, value=val_cell)

# сохраняем и смотрим что получилось
wb.save("styled_border.xlsx")
Заливка ячеек цветом и цвет текста.
Цвет заливки ячеек выставляется атрибутом ячейки .fill и классом PatternFill().
Обязательный аргумент fill_type (по умолчанию равен None) класса PatternFill() может принимать значения:
- если
fill_type='solid', то нужно обязательно указывать аргумент цвета заливкиfgColor. - следующие значения аргумента
fill_typeприменяются самостоятельно (без аргументаfgColor) и представляют собой предустановленные цвета заливки :‘darkHorizontal’,‘lightDown’,‘lightGray’,‘darkDown’,‘darkGrid’,‘darkUp’,‘darkGray’,‘darkVertical’,‘darkTrellis’,‘mediumGray’,‘lightVertical’,‘lightTrellis’,‘lightGrid’,‘lightHorizontal’,‘gray0625’,‘lightUp’,‘gray125’.
Внимание: если аргумент fill_type не указан, то fgColor не будет иметь никакого эффекта!
Пример заливки одной ячейки:
>>> from openpyxl import Workbook
>>> from openpyxl.styles import PatternFill, Font, Alignment
>>> wb = Workbook()
>>> ws = wb.active
# объединим ячейки в диапазоне `B2:E2`
>>> ws.merge_cells('B2:E2')
>>> megre_cell = ws['B2']
# запишем в нее текст
>>> megre_cell.value = 'Объединенные ячейки `B2 : E2`'
# установить высоту строки
>>> ws.row_dimensions[2].height = 30
# установить ширину столбца
>>> ws.column_dimensions['B'].width = 40
# заливка ячейки цветом
>>> megre_cell.fill = PatternFill('solid', fgColor="DDDDDD")
# шрифт и цвет текста ячейки
>>> megre_cell.font = Font(bold=True, color='FF0000', name='Arial', size=14)
# ну и для красоты выровним текст
>>> megre_cell.alignment = Alignment(horizontal='center', vertical='center')
# сохраняем и смотрим что получилось
>>> wb.save("cell_color.xlsx")
Именованные стили NamedStyle.
В отличие от простых стилей ячеек, именованные стили изменяемы и используется для объединения в себе нескольких стилей, таких как шрифты, границы, выравнивание и т. д. Они имеют смысл, когда необходимо применить форматирование к множеству разных ячеек одновременно. Об именованных стилях можно думать как о классах CSS при оформлении HTML-разметки. Именованные стили регистрируются в рабочей книге.
Примечание. После назначения ячейке именованного стиля, дальнейшие/дополнительные изменения этого стиля не повлияют на стиль ячейки.
Как только именованный стиль зарегистрирован в рабочей книге, на него можно ссылаться просто по имени.
Создание именованного стиля.
>>> from openpyxl.styles import NamedStyle, Font, Border, Side
# создание переменной именованного стиля
>>> name_style = NamedStyle(name="highlight")
# применение стилей к созданной переменной
>>> name_style.font = Font(bold=True, size=20)
>>> bd = Side(style='thick', color="000000")
>>> name_style.border = Border(left=bd, top=bd, right=bd, bottom=bd)
После создания именованного стиля его нужно зарегистрировать в рабочей книге:
>>> wb.add_named_style(name_style)
Именованные стили также будут автоматически зарегистрированы при первом назначении их ячейке:
>>> ws['A1'].style = name_style
После регистрации стиля в рабочей книге, применять его можно только по имени:
>>> ws['D5'].style = 'highlight'
Встроенные стили в Excel.
Спецификация включает в себя некоторые встроенные стили, которые также могут быть использованы. К сожалению, имена для этих стилей хранятся в их локализованных формах. OpenPyxl узнает только английские имена и только так, как они записаны в официальной документации.
Использование встроенных в Excel стилей здесь не рассматривается, так как при их применении могу возникать существенные искажения.
Introduction
Styles are used to change the look of your data while displayed on screen.
They are also used to determine the formatting for numbers.
Styles can be applied to the following aspects:
- font to set font size, color, underlining, etc.
- fill to set a pattern or color gradient
- border to set borders on a cell
- cell alignment
- protection
The following are the default values
>>> from openpyxl.styles import PatternFill, Border, Side, Alignment, Protection, Font
>>> font = Font(name='Calibri',
...                 size=11,
...                 bold=False,
...                 italic=False,
...                 vertAlign=None,
...                 underline='none',
...                 strike=False,
...                 color='FF000000')
>>> fill = PatternFill(fill_type=None,
...                 start_color='FFFFFFFF',
...                 end_color='FF000000')
>>> border = Border(left=Side(border_style=None,
...                           color='FF000000'),
...                 right=Side(border_style=None,
...                            color='FF000000'),
...                 top=Side(border_style=None,
...                          color='FF000000'),
...                 bottom=Side(border_style=None,
...                             color='FF000000'),
...                 diagonal=Side(border_style=None,
...                               color='FF000000'),
...                 diagonal_direction=0,
...                 outline=Side(border_style=None,
...                              color='FF000000'),
...                 vertical=Side(border_style=None,
...                               color='FF000000'),
...                 horizontal=Side(border_style=None,
...                                color='FF000000')
...                )
>>> alignment=Alignment(horizontal='general',
...                     vertical='bottom',
...                     text_rotation=0,
...                     wrap_text=False,
...                     shrink_to_fit=False,
...                     indent=0)
>>> number_format = 'General'
>>> protection = Protection(locked=True,
...                         hidden=False)
>>>
Cell Styles and Named Styles
There are two types of styles: cell styles and named styles, also known as style templates.
Cell Styles
Cell styles are shared between objects and once they have been assigned they
cannot be changed. This stops unwanted side-effects such as changing the
style for lots of cells when only one changes.
>>> from openpyxl.styles import colors
>>> from openpyxl.styles import Font, Color
>>> from openpyxl import Workbook
>>> wb = Workbook()
>>> ws = wb.active
>>>
>>> a1 = ws['A1']
>>> d4 = ws['D4']
>>> ft = Font(color="FF0000")
>>> a1.font = ft
>>> d4.font = ft
>>>
>>> a1.font.italic = True # is not allowed # doctest: +SKIP
>>>
>>> # If you want to change the color of a Font, you need to reassign it::
>>>
>>> a1.font = Font(color="FF0000", italic=True) # the change only affects A1
Copying styles
Styles can also be copied
>>> from openpyxl.styles import Font
>>> from copy import copy
>>>
>>> ft1 = Font(name='Arial', size=14)
>>> ft2 = copy(ft1)
>>> ft2.name = "Tahoma"
>>> ft1.name
'Arial'
>>> ft2.name
'Tahoma'
>>> ft2.size # copied from the
14.0
Colours
Colours for fonts, backgrounds, borders, etc. can be set in three ways: indexed, aRGB or theme. Indexed colours are the legacy implementation and the colours themselves depend upon the index provided with the workbook or with the application default. Theme colours are useful for complementary shades of colours but also depend upon the theme being present in the workbook. It is, therefore, advisable to use aRGB colours.
aRGB colours
RGB colours are set using hexadecimal values for red, green and blue.
>>> from openpyxl.styles import Font
>>> font = Font(color="FF0000")
The alpha value refers in theory to the transparency of the colour but this is not relevant for cell styles. The default of 00 will prepended to any simple RGB value:
>>> from openpyxl.styles import Font
>>> font = Font(color="00FF00")
>>> font.color.rgb
'0000FF00'
There is also support for legacy indexed colours as well as themes and tints.
>>> from openpyxl.styles.colors import Color
>>> c = Color(indexed=32)
>>> c = Color(theme=6, tint=0.5)
Indexed Colours
| Index | |||||
|---|---|---|---|---|---|
| 0-4 | 00000000 | 00FFFFFF | 00FF0000 | 0000FF00 | 000000FF |
| 5-9 | 00FFFF00 | 00FF00FF | 0000FFFF | 00000000 | 00FFFFFF |
| 10-14 | 00FF0000 | 0000FF00 | 000000FF | 00FFFF00 | 00FF00FF |
| 15-19 | 0000FFFF | 00800000 | 00008000 | 00000080 | 00808000 |
| 20-24 | 00800080 | 00008080 | 00C0C0C0 | 00808080 | 009999FF |
| 25-29 | 00993366 | 00FFFFCC | 00CCFFFF | 00660066 | 00FF8080 |
| 30-34 | 000066CC | 00CCCCFF | 00000080 | 00FF00FF | 00FFFF00 |
| 35-39 | 0000FFFF | 00800080 | 00800000 | 00008080 | 000000FF |
| 40-44 | 0000CCFF | 00CCFFFF | 00CCFFCC | 00FFFF99 | 0099CCFF |
| 45-49 | 00FF99CC | 00CC99FF | 00FFCC99 | 003366FF | 0033CCCC |
| 50-54 | 0099CC00 | 00FFCC00 | 00FF9900 | 00FF6600 | 00666699 |
| 55-60 | 00969696 | 00003366 | 00339966 | 00003300 | 00333300 |
| 60-63 | 00993300 | 00993366 | 00333399 | 00333333 | |
The indices 64 and 65 cannot be set and are reserved for the system foreground and background colours respectively.
Applying Styles
Styles are applied directly to cells
>>> from openpyxl.workbook import Workbook
>>> from openpyxl.styles import Font, Fill
>>> wb = Workbook()
>>> ws = wb.active
>>> c = ws['A1']
>>> c.font = Font(size=12)
Styles can also applied to columns and rows but note that this applies only
to cells created (in Excel) after the file is closed. If you want to apply
styles to entire rows and columns then you must apply the style to each cell
yourself. This is a restriction of the file format:
>>> col = ws.column_dimensions['A']
>>> col.font = Font(bold=True)
>>> row = ws.row_dimensions[1]
>>> row.font = Font(underline="single")
Styling Merged Cells
The merged cell behaves similarly to other cell objects.
Its value and format is defined in its top-left cell.
In order to change the border of the whole merged cell,
change the border of its top-left cell.
The formatting is generated for the purpose of writing.
>>> from openpyxl.styles import Border, Side, PatternFill, Font, GradientFill, Alignment
>>> from openpyxl import Workbook
>>>
>>> wb = Workbook()
>>> ws = wb.active
>>> ws.merge_cells('B2:F4')
>>>
>>> top_left_cell = ws['B2']
>>> top_left_cell.value = "My Cell"
>>>
>>> thin = Side(border_style="thin", color="000000")
>>> double = Side(border_style="double", color="ff0000")
>>>
>>> top_left_cell.border = Border(top=double, left=thin, right=thin, bottom=double)
>>> top_left_cell.fill = PatternFill("solid", fgColor="DDDDDD")
>>> top_left_cell.fill = fill = GradientFill(stop=("000000", "FFFFFF"))
>>> top_left_cell.font  = Font(b=True, color="FF0000")
>>> top_left_cell.alignment = Alignment(horizontal="center", vertical="center")
>>>
>>> wb.save("styled.xlsx")
Using number formats
You can specify the number format for cells, or for some instances (ie datetime) it will automatically format.
>>> import datetime
>>> from openpyxl import Workbook
>>> wb = Workbook()
>>> ws = wb.active
>>> # set date using a Python datetime
>>> ws['A1'] = datetime.datetime(2010, 7, 21)
>>>
>>> ws['A1'].number_format
'yyyy-mm-dd h:mm:ss'
>>>
>>> ws["A2"] = 0.123456
>>> ws["A2"].number_format = "0.00" # Display to 2dp
Edit Page Setup
>>> from openpyxl.workbook import Workbook
>>>
>>> wb = Workbook()
>>> ws = wb.active
>>>
>>> ws.page_setup.orientation = ws.ORIENTATION_LANDSCAPE
>>> ws.page_setup.paperSize = ws.PAPERSIZE_TABLOID
>>> ws.page_setup.fitToHeight = 0
>>> ws.page_setup.fitToWidth = 1
Named Styles
In contrast to Cell Styles, Named Styles are mutable. They make sense when
you want to apply formatting to lots of different cells at once. NB. once you
have assigned a named style to a cell, additional changes to the style will
not affect the cell.
Once a named style has been registered with a workbook, it can be referred to simply by name.
Creating a Named Style
>>> from openpyxl.styles import NamedStyle, Font, Border, Side
>>> highlight = NamedStyle(name="highlight")
>>> highlight.font = Font(bold=True, size=20)
>>> bd = Side(style='thick', color="000000")
>>> highlight.border = Border(left=bd, top=bd, right=bd, bottom=bd)
Once a named style has been created, it can be registered with the workbook:
>>> wb.add_named_style(highlight)
But named styles will also be registered automatically the first time they are assigned to a cell:
>>> ws['A1'].style = highlight
Once registered, assign the style using just the name:
>>> ws['D5'].style = 'highlight'
Using builtin styles
The specification includes some builtin styles which can also be used.
Unfortunately, the names for these styles are stored in their localised
forms. openpyxl will only recognise the English names and only exactly as
written here. These are as follows:
- ‘Normal’ # same as no style
Number formats
- ‘Comma’
- ‘Comma [0]’
- ‘Currency’
- ‘Currency [0]’
- ‘Percent’
Informative
- ‘Calculation’
- ‘Total’
- ‘Note’
- ‘Warning Text’
- ‘Explanatory Text’
Text styles
- ‘Title’
- ‘Headline 1’
- ‘Headline 2’
- ‘Headline 3’
- ‘Headline 4’
- ‘Hyperlink’
- ‘Followed Hyperlink’
- ‘Linked Cell’
Comparisons
- ‘Input’
- ‘Output’
- ‘Check Cell’
- ‘Good’
- ‘Bad’
- ‘Neutral’
Highlights
- ‘Accent1’
- ‘20 % — Accent1’
- ‘40 % — Accent1’
- ‘60 % — Accent1’
- ‘Accent2’
- ‘20 % — Accent2’
- ‘40 % — Accent2’
- ‘60 % — Accent2’
- ‘Accent3’
- ‘20 % — Accent3’
- ‘40 % — Accent3’
- ‘60 % — Accent3’
- ‘Accent4’
- ‘20 % — Accent4’
- ‘40 % — Accent4’
- ‘60 % — Accent4’
- ‘Accent5’
- ‘20 % — Accent5’
- ‘40 % — Accent5’
- ‘60 % — Accent5’
- ‘Accent6’
- ‘20 % — Accent6’
- ‘40 % — Accent6’
- ‘60 % — Accent6’
- ‘Pandas’
For more information about the builtin styles please refer to the openpyxl.styles.builtins
OpenPyXL gives you the ability to style your cells in many different ways. Styling cells will give your spreadsheets pizazz! Your spreadsheets can have some pop and zing to them that will help differentiate them from others. However, don’t go overboard! If every cell had a different font and color, your spreadsheet would look like a mess.
You should use the skills that you learn in this article sparingly. You’ll still have beautiful spreadsheets that you can share with your colleagues. If you would like to learn more about what styles OpenPyXL supports, you should check out their documentation.
In this article, you will learn about the following:
- Working with fonts
- Setting the alignment
- Adding a border
- Changing the cell background-color
- Inserting images into cells
- Styling merged cells
- Using a built-in style
- Creating a custom named style
Now that you know what you’re going to learn, it’s time to get started by discovering how to work with fonts using OpenPyXL!
Working with Fonts
You use fonts to style your text on a computer. A font controls the size, weight, color, and style of the text you see on-screen or in print. There are thousands of fonts that your computer can use. Microsoft includes many fonts with its Office products.
When you want to set a font with OpenPyXL, you will need to import the Font class from openpyxl.styles. Here is how you would do the import:
from openpyxl.styles import Font
The Font class takes many parameters. Here is the Font class’s full list of parameters according to OpenPyXL’s documentation:
class openpyxl.styles.fonts.Font(name=None, sz=None, b=None, i=None, charset=None, u=None,
    strike=None, color=None, scheme=None, family=None, size=None, bold=None, italic=None,
    strikethrough=None, underline=None, vertAlign=None, outline=None, shadow=None,
    condense=None, extend=None)
The following list shows the parameters you are most likely to use and their defaults:
- name=’Calibri’
- size=11
- bold=False
- italic=False
- vertAlign=None
- underline=’none’
- strike=False
- color=’FF000000′
These settings allow you to set most of the things you’ll need to make your text look nice. Note that the color names in OpenPyXL use hexadecimal values to represent RGB (red, green, blue) color values. You can set whether or not the text should be bold, italic, underlined, or struck-through.
To see how you can use fonts in OpenPyXL, create a new file named font_sizes.py and add the following code to it:
# font_sizes.py

import openpyxl
from openpyxl.styles import Font


def font_demo(path):
    workbook = openpyxl.Workbook()
    sheet = workbook.active
    cell = sheet["A1"]
    cell.font = Font(size=12)
    cell.value = "Hello"

    cell2 = sheet["A2"]
    cell2.font = Font(name="Arial", size=14, color="00FF0000")
    sheet["A2"] = "from"

    cell2 = sheet["A3"]
    cell2.font = Font(name="Tahoma", size=16, color="00339966")
    sheet["A3"] = "OpenPyXL"

    workbook.save(path)


if __name__ == "__main__":
    font_demo("font_demo.xlsx")
This code uses three different fonts in three different cells. In A1, you use the default, which is Calibri. Then in A2, you set the font size to Arial and increase the size to 14 points. Finally, in A3, you change the font to Tahoma and the font size to 16 points.
For the second and third fonts, you also change the text color. In A2, you set the color to red, and in A3, you set the color to green.
When you run this code, your output will look like this:

Try changing the code to use other fonts or colors. If you want to get adventurous, you should try to make your text bold or italicized.
Now you’re ready to learn about text alignment.
Setting the Alignment
You can set alignment in OpenPyXL by using openpyxl.styles.Alignment. You use this class to rotate the text, set text wrapping, and for indentation.
Here are the defaults that the Alignment class uses:
- horizontal=’general’
- vertical=’bottom’
- text_rotation=0
- wrap_text=False
- shrink_to_fit=False
- indent=0
It’s time for you to get some practice in. Open up your Python editor and create a new file named alignment.py. Then add this code to it:
# alignment.py

from openpyxl import Workbook
from openpyxl.styles import Alignment


def center_text(path, horizontal="center", vertical="center"):
    workbook = Workbook()
    sheet = workbook.active
    sheet["A1"] = "Hello"
    sheet["A1"].alignment = Alignment(horizontal=horizontal,
                                      vertical=vertical)
    sheet["A2"] = "from"
    sheet["A3"] = "OpenPyXL"
    sheet["A3"].alignment = Alignment(text_rotation=90)
    workbook.save(path)


if __name__ == "__main__":
    center_text("alignment.xlsx")
You will center the string both horizontally and vertically in A1 when you run this code. Then you use the defaults for A2. Finally, for A3, you rotate the text 90 degrees.
Try running this code, and you will see something like the following:

That looks nice! It would be best if you took the time to try out different text_rotation values. Then try changing the horizontal and vertical parameters with different values. Pretty soon, you will be able to align your text like a pro!
Now you’re ready to learn about adding borders to your cells!
Adding a Border
OpenPyXL gives you the ability to style the borders on your cell. You can specify a different border style for each of the four sides of a cell.
You can use any of the following border styles:
- ‘dashDot’
- ‘dashDotDot’
- ‘dashed’
- ‘dotted’
- ‘double’
- ‘hair’
- ‘medium’
- ‘mediumDashDot’
- ‘mediumDashDotDot’,
- ‘mediumDashed’
- ‘slantDashDot’
- ‘thick’
- ‘thin’
Open your Python editor and create a new file named border.py. Then enter the following code in your file:
# border.py

from openpyxl import Workbook
from openpyxl.styles import Border, Side


def border(path):
    pink = "00FF00FF"
    green = "00008000"
    thin = Side(border_style="thin", color=pink)
    double = Side(border_style="double", color=green)

    workbook = Workbook()
    sheet = workbook.active

    sheet["A1"] = "Hello"
    sheet["A1"].border = Border(top=double, left=thin, right=thin, bottom=double)
    sheet["A2"] = "from"
    sheet["A3"] = "OpenPyXL"
    sheet["A3"].border = Border(top=thin, left=double, right=double, bottom=thin)
    workbook.save(path)


if __name__ == "__main__":
    border("border.xlsx")
This code will add a border to cell A1 and A3. The top and bottom of A1 use a “double” border style and are green, while the cell sides are using a “thin” border style and are colored pink.
Cell A3 uses the same borders but swaps them so that the sides are now green and the top and bottom are pink.
You get this effect by creating Side objects in the border_style and the color to be used. Then you pass those Side objects to a Border class, which allows you to set each of the four sides of a cell individually. To apply the Border to a cell, you must set the cell’s border attribute.
When you run this code, you will see the following result:

This image is zoomed in a lot so that you can easily see the borders of the cells. It would be best if you tried modifying this code with some of the other border styles mentioned at the beginning of this section so that you can see what else you can do.
Changing the Cell Background Color
You can highlight a cell or a range of cells by changing its background color. Highlighting a cell is more eye-catching than changing the text’s font or color in most cases. OpenPyXL gives you a class called PatternFill that you can use to change a cell’s background color.
The PatternFill class takes in the following arguments (defaults included below):
- patternType=None
- fgColor=Color()
- bgColor=Color()
- fill_type=None
- start_color=None
- end_color=None
There are several different fill types you can use. Here is a list of currently supported fill types:
- ‘none’
- ‘solid’
- ‘darkDown’
- ‘darkGray’
- ‘darkGrid’
- ‘darkHorizontal’
- ‘darkTrellis’
- ‘darkUp’
- ‘darkVertical’
- ‘gray0625’
- ‘gray125’
- ‘lightDown’
- ‘lightGray’
- ‘lightGrid’
- ‘lightHorizontal’
- ‘lightTrellis’
- ‘lightUp’
- ‘lightVertical’
- ‘mediumGray’
Now you have enough information to try setting the background color of a cell using OpenPyXL. Open up a new file in your Python editor and name it background_colors.py. Then add this code to your new file:
# background_colors.py

from openpyxl import Workbook
from openpyxl.styles import PatternFill


def background_colors(path):
    workbook = Workbook()
    sheet = workbook.active
    yellow = "00FFFF00"
    for rows in sheet.iter_rows(min_row=1, max_row=10, min_col=1, max_col=12):
        for cell in rows:
            if cell.row % 2:
                cell.fill = PatternFill(start_color=yellow, end_color=yellow,
                                        fill_type = "solid")
    workbook.save(path)


if __name__ == "__main__":
    background_colors("bg.xlsx")
This example will iterate over nine rows and 12 columns. It will set every cell’s background color to yellow if that cell is in an odd-numbered row. The cells with their background color changes will be from column A through column L.
When you want to set the cell’s background color, you set the cell’s fill attribute to an instance of PatternFill. In this example, you specify a start_color and an end_color. You also set the fill_type to “solid”. OpenPyXL also supports using a GradientFill for the background.
Try running this code. After it runs, you will have a new Excel document that looks like this:

Here are some ideas that you can try out with this code:
- Change the number of rows or columns that are affected
- Change the color that you are changing to
- Update the code to color the even rows with a different color
- Try out other fill types
Once you are done experimenting with background colors, you can learn about inserting images in your cells!
Inserting Images into Cells
OpenPyXL makes inserting an image into your Excel spreadsheets nice and straightforward. To make this magic happen, you use the Worksheet object’s add_image() method. This method takes in two arguments:
img– The path to the image file that you are insertinganchor– Provide a cell as a top-left anchor of the image (optional)
For this example, you will be using the Mouse vs. Python logo:
![]()
The GitHub repository for this book has the image for you to use.
Once you have the image downloaded, create a new Python file and name it insert_image.py. Then add the following:
# insert_image.py

from openpyxl import Workbook
from openpyxl.drawing.image import Image


def insert_image(path, image_path):
    workbook = Workbook()
    sheet = workbook.active
    img = Image("logo.png")
    sheet.add_image(img, "B1")
    workbook.save(path)


if __name__ == "__main__":
    insert_image("logo.xlsx", "logo.png")
Here you pass in the path to the image that you wish to insert. To insert the image, you call add_image(). In this example, you are hard-coding to use cell B1 as the anchor cell. Then you save your Excel spreadsheet.
If you open up your spreadsheet, you will see that it looks like this:
![]()
You probably won’t need to insert an image into an Excel spreadsheet all that often, but it’s an excellent skill to have.
Styling Merged Cells
Merged cells are cells where you have two or more adjacent cells merged into one. If you want to set the value of a merged cell with OpenPyXL, you must use the top left-most cell of the merged cells.
You also must use this particular cell to set the style for the merged cell as a whole. You can use all the styles and font settings you used on an individual cell with the merged cell. However, you must apply the style to the top-left cell for it to apply to the entire merged cell.
You will understand how this works if you see some code. Go ahead and create a new file named style_merged_cell.py. Now enter this code in your file:
# style_merged_cell.py

from openpyxl import Workbook
from openpyxl.styles import Font, Border, Side, GradientFill, Alignment


def merge_style(path):
    workbook = Workbook()
    sheet = workbook.active
    sheet.merge_cells("A2:G4")
    top_left_cell = sheet["A2"]

    light_purple = "00CC99FF"
    green = "00008000"
    thin = Side(border_style="thin", color=light_purple)
    double = Side(border_style="double", color=green)

    top_left_cell.value = "Hello from PyOpenXL"
    top_left_cell.border = Border(top=double, left=thin, right=thin,
                                  bottom=double)
    top_left_cell.fill = GradientFill(stop=("000000", "FFFFFF"))
    top_left_cell.font = Font(b=True, color="FF0000", size=16)
    top_left_cell.alignment = Alignment(horizontal="center",
                                        vertical="center")
    workbook.save(path)


if __name__ == "__main__":
    merge_style("merged_style.xlsx")
Here you create a merged cell that starts at A2 (the top-left cell) through G4. Then you set the cell’s value, border, fill, font and alignment.
When you run this code, your new spreadsheet will look like this:

Doesn’t that look nice? You should take some time and try out some different styles on your merged cell. Maybe come up with a better gradient than the gray one used here, for example.
Now you’re ready to learn about OpenPyXL’s built-in styles!
Using a Built-in Style
OpenPyXL comes with multiple built-in styles that you can use as well. Rather than reproducing the entire list of built-in styles in this book, you should go to the official documentation as it will be the most up-to-date source for the style names.
However, it is worth noting some of the styles. For example, here are the number format styles you can use:
- ‘Comma’
- ‘Comma [0]’
- ‘Currency’
- ‘Currency [0]’
- ‘Percent’
You can also apply text styles. Here is a listing of those styles:
- ‘Title’
- ‘Headline 1’
- ‘Headline 2’
- ‘Headline 3’
- ‘Headline 4’
- ‘Hyperlink’
- ‘Followed Hyperlink’
- ‘Linked Cell’
OpenPyXL has several other built-in style groups. You should check out the documentation to learn about all the different styles that are supported.
Now that you know about some of the built-in styles you can use, it’s time to write some code! Create a new file and name it builtin_styls.py. Then enter the following code:
# builtin_styles.py

from openpyxl import Workbook


def builtin_styles(path):
    workbook = Workbook()
    sheet = workbook.active
    sheet["A1"].value = "Hello"
    sheet["A1"].style = "Title"

    sheet["A2"].value = "from"
    sheet["A2"].style = "Headline 1"

    sheet["A3"].value = "OpenPyXL"
    sheet["A3"].style = "Headline 2"

    workbook.save(path)


if __name__ == "__main__":
    builtin_styles("builtin_styles.xlsx")
Here you apply three different styles to three different cells. You use “Title”, “Headline 1” and “Headline 2”, specifically.
When you run this code, you will end up having a spreadsheet that looks like this:

As always, you should try out some of the other built-in styles. Trying them out is the only way to determine what they do and if they will work for you.
But wait! What if you wanted to create your style? That’s what you will cover in the next section!
Creating a Custom Named Style
You can create custom styles of your design using OpenPyXL as well. To create your style, you must use the NamedStyle class.
The NamedStyle class takes the following arguments (defaults are included too):
- name=”Normal”
- font=Font()
- fill=PatternFill()
- border=Border()
- alignment=Alignment()
- number_format=None
- protection=Protection()
- builtinId=None
- hidden=False
- xfId=None
You should always provide your own name to your NamedStyle to keep it unique. Go ahead and create a new file and call it named_style.py. Then add this code to it:
# named_style.py

from openpyxl import Workbook
from openpyxl.styles import Font, Border, Side, NamedStyle


def named_style(path):
    workbook = Workbook()
    sheet = workbook.active

    red = "00FF0000"
    font = Font(bold=True, size=22)
    thick = Side(style="thick", color=red)
    border = Border(left=thick, right=thick, top=thick, bottom=thick)
    named_style = NamedStyle(name="highlight", font=font, border=border)

    sheet["A1"].value = "Hello"
    sheet["A1"].style = named_style

    sheet["A2"].value = "from"
    sheet["A3"].value = "OpenPyXL"

    workbook.save(path)


if __name__ == "__main__":
    named_style("named_style.xlsx")
Here you create a Font(), Side(), and Border() instance to pass to your NamedStyle(). Once you have your custom style created, you can apply it to a cell by setting the cell’s style attribute. Applying a custom style is done in the same way as you applied built-in styles!
You applied the custom style to the cell, A1.
When you run this code, you will get a spreadsheet that looks like this:

Now it’s your turn! Edit the code to use a Side style, which will change your border. Or create multiple Side instances so you can make each side of the cell unique. Play around with different fonts or add a custom background color!
Wrapping Up
You can do a lot of different things with cells using OpenPyXL. The information in this article gives you the ability to format your data in beautiful ways.
In this article, you learned about the following topics:
- Working with fonts
- Setting the alignment
- Adding a border
- Changing the cell background-color
- Inserting images into cells
- Styling merged cells
- Using a built-in style
- Creating a custom named style
You can take the information that you learned in this article to make beautiful spreadsheets. You can highlight exciting data by changing the cell’s background color or font. You can also change the cell’s format by using a built-in style. Go ahead and give it a try.
Experiment with the code in this article and see how powerful and valuable OpenPyXL is when working with cells.
Related Reading
- Reading Spreadsheets with OpenPyXL and Python
- Creating Spreadsheets with OpenPyXL and Python
- Automating Excel with Python (book)
Last Updated on July 14, 2022 by
This tutorial will show you how to use the Python openpyxl library to customize Excel formatting such as cell color, alignment, borderlines, etc. We’ll continue with the previous example to make our monthly budget spreadsheet look prettier.
Library
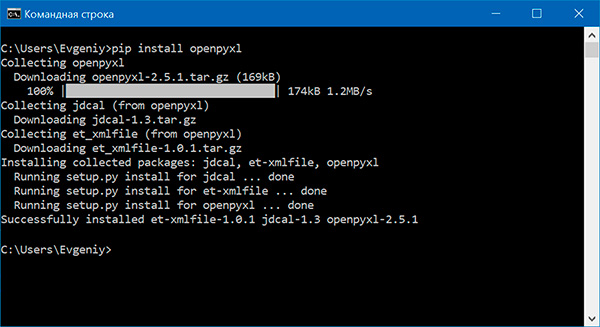
The only library required is openpyxl, type the following in the command prompt window to install the library:
pip install openpyxlIn openpyxl, each Cell object has a bunch of attributes we can use for formatting:
| Attribute | Usage |
| Cell.font | font style, size, color, etc |
| Cell.number_format | number formats |
| Cell.fill | cell color and pattern |
| Cell.border | cell border |
| Cell.alignment | text alignment |
Collectively, these attributes are called styles but I still prefer calling them just formats. One thing to note is that we can apply styles to only one cell at a time. So we’ll need to do a loop in order to format a range of cells.
Color – Pattern (solid) Fill
There are two types of cell color formatting: Pattern Fill and Gradient Fill.
We use Pattern Fill to make a solid color or a pattern for the cell. A Pattern Fill refers to the following formatting in Excel:

The below code changes cells B11:C11 to a light gray background and changes cells B19:C19 to a dotted background known as 6.25% Gray (found in the Pattern Style dropbox). To make the formatting easier to see, we’ll hide all gridlines in Excel by setting ws.sheet_view.showGridLines to False.
from openpyxl.styles import PatternFill, GradientFill
ws.sheet_view.showGridLines = False

for c in ws['B11:C11'][0]:
    c.fill = PatternFill('solid', fgColor = 'F2F2F2')

for c in ws['B19:C19'][0]:
    c.fill = PatternFill('gray0625')
Color – Gradient Fill
A Gradient Fill usually takes two colors and interpolates colors between them and fills the cell background. The following code takes a cyan color (’85E4F7′) and a light blue color (‘4617F1’) for the gradient fill. You can change the two RGB hex code inside the stop argument to any color to create your own gradient fill.
ws['E7'].fill = GradientFill('linear', stop = ('85E4F7','4617F1'))
ws['E9'].fill = GradientFill('linear', stop = ('85E4F7','4617F1'))
ws['E11'].fill = GradientFill('linear', stop = ('85E4F7','4617F1'))
ws['E13'].fill = GradientFill('linear', stop = ('85E4F7','4617F1'))
Borderlines
Borderlines refer to the four sides of a cell. With openpyxl, we can control the style (solid vs dash, etc), thickness, color, and position of the borderlines. We need two objects to model a cell’s borderline: Border and Side.
A Border can contain one or multiple Sides. Then we assign the cell.border attribute to a Border object to create the borderlines.
from openpyxl.styles import Border, Side

double = Side(border_style="double", color="4617F1")
thin = Side(border_style="thin", color="4617F1")
regular = Side(border_style="medium", color="000000")

## For the title cells B2 to F2
for c in ws['B2:F2'][0]:
    c.border = Border(bottom=double, top=thin)


no_left_side = Border(top = regular,bottom=regular,right=regular)
no_right_side = Border(top = regular,bottom=regular, left=regular)
box = Border(top = regular,bottom=regular, left=regular,right=regular)

## For the "table-like" cells
for c in ws['B8:B11']+ws['B15:B19']:
    c[0].border = no_left_side

for c in ws['C8:C11']+ws['C15:C19']:
    c[0].border = no_right_side
Text Alignment
We use the Alignment object to model text/number alignment within a cell, then assign the cell.alignment attribute to the object.
from openpyxl.styles import Alignment

center_align = Alignment(horizontal='center', vertical='center')

for c in ws['C8:C11']+ws['C15:C19']:
    c[0].border = no_right_side
    c[0].alignment = center_align

for c in ws['F7:F14']:
    c[0].alignment = center_align
Additional Resources
Python & Excel – Number Format
Python openpyxl – How to Insert Rows, Columns in Excel
Adjust Excel Fonts using Python openpyxl
Write Data to Excel using Python
Документ электронной таблицы Excel называется рабочей книгой. Каждая книга может хранить некоторое количество листов. Лист, просматриваемый пользователем в данный момент, называется активным. Лист состоит из из столбцов (адресуемых с помощью букв, начиная с A) и строк (адресуемых с помощью цифр, начиная с 1).
Модуль OpenPyXL не поставляется вместе с Python, поэтому его предварительно нужно установить:
> pip install openpyxl
Чтение файлов Excel
Начинаем работать:
>>> import openpyxl
>>> wb = openpyxl.load_workbook('example.xlsx')
>>> type(wb)
<class 'openpyxl.workbook.workbook.Workbook'>
>>> wb.sheetnames
['Лист1', 'Лист2', 'Лист3']
>>> sheet = wb.active
>>> sheet
<Worksheet "Лист1">
>>> sheet['A1']
<Cell Лист1.A1>
А теперь небольшой скрипт:
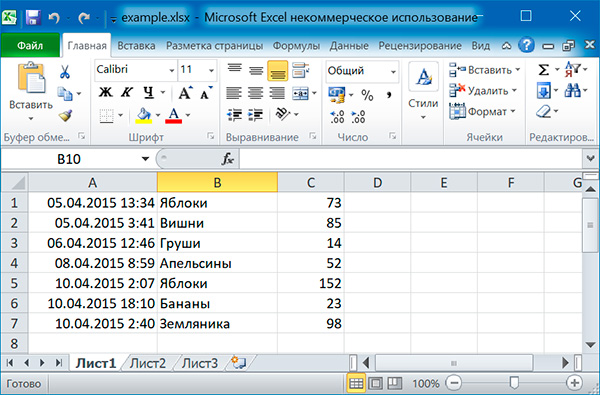
import openpyxl

# читаем excel-файл
wb = openpyxl.load_workbook('example.xlsx')

# печатаем список листов
sheets = wb.sheetnames
for sheet in sheets:
    print(sheet)

# получаем активный лист
sheet = wb.active

# печатаем значение ячейки A1
print(sheet['A1'].value)
# печатаем значение ячейки B1
print(sheet['B1'].value)
Результат работы:
Лист1
Лист2
Лист3

2015-04-05 13:34:02
Яблоки
Как получить другой лист книги:
# получаем другой лист
sheet2 = wb['Лист2']
# печатаем значение ячейки A1
print(sheet2['A2'].value)
Как сделать лист книги активным:
# делаем третий лист активным
wb.active = 2
Как задать имя листа:
sheet.title = 'Третий лист'
Объект Cell имеет атрибут value, который содержит значение, хранящееся в ячейке. Объект Cell также имеет атрибуты row, column и coordinate, которые предоставляют информацию о расположении данной ячейки в таблице.
# получаем ячейку листа B2
cell = sheet['B2']
print('Строка: ' + str(cell.row))
print('Столбец: ' + cell.column)
print('Ячейка: ' + cell.coordinate)
print('Значение: ' + cell.value)
Строка: 2
Столбец: B
Ячейка: B2
Значение: Вишни
К отдельной ячейке можно также обращаться с помощью метода cell() объекта Worksheet, передавая ему именованные аргументы row и column. Первому столбцу или первой строке соответствует число 1, а не 0:
# получаем ячейку листа B2
cell = sheet.cell(row = 2, column = 2)
print(cell.value)
Вишни
Размер листа можно получить с помощью атрибутов max_row и max_column объекта Worksheet:
rows = sheet.max_row
cols = sheet.max_column

for i in range(1, rows + 1):
    string = ''
    for j in range(1, cols + 1):
        cell = sheet.cell(row = i, column = j)
        string = string + str(cell.value) + ' '
    print(string)
2015-04-05 13:34:02 Яблоки 73
2015-04-05 03:41:23 Вишни 85
2015-04-06 12:46:51 Груши 14
2015-04-08 08:59:43 Апельсины 52
2015-04-10 02:07:00 Яблоки 152
2015-04-10 18:10:37 Бананы 23
2015-04-10 02:40:46 Земляника 98
Чтобы преобразовать буквенное обозначение столбца в цифровое, следует вызвать функцию
openpyxl.utils.column_index_from_string()
Чтобы преобразовать цифровое обозначение столбуа в буквенное, следует вызвать функцию
openpyxl.utils.get_column_letter()
Для вызова этих функций загружать рабочую книгу не обязательно.
>>> from openpyxl.utils import get_column_letter, column_index_from_string
>>> get_column_letter(1)
'A'
>>> get_column_letter(27)
'AA'
>>> column_index_from_string('A')
1
>>> column_index_from_string('AA')
27
Используя срезы объектов Worksheet, можно получить все объекты Cell, принадлежащие определенной строке, столбцу или прямоугольной области.
>>> sheet['A1':'C3']
((<Cell 'Лист1'.A1>, <Cell 'Лист1'.B1>, <Cell 'Лист1'.C1>),
 (<Cell 'Лист1'.A2>, <Cell 'Лист1'.B2>, <Cell 'Лист1'.C2>),
 (<Cell 'Лист1'.A3>, <Cell 'Лист1'.B3>, <Cell 'Лист1'.C3>))
for row in sheet['A1':'C3']:
    string = ''
    for cell in row:
        string = string + str(cell.value) + ' '
    print(string)
2015-04-05 13:34:02 Яблоки 73
2015-04-05 03:41:23 Вишни 85
2015-04-06 12:46:51 Груши 14
Выводим значения второй колонки:
>>> sheet['B']
(<Cell 'Лист1'.B1>, <Cell 'Лист1'.B2>, <Cell 'Лист1'.B3>, <Cell 'Лист1'.B4>, ..., <Cell 'Лист1'.B7>)
for cell in sheet['B']:
    print(cell.value)
Яблоки
Вишни
Груши
Апельсины
Яблоки
Бананы
Земляника
Выводим строки с первой по третью:
>>> sheet[1:3]
((<Cell 'Лист1'.A1>, <Cell 'Лист1'.B1>, <Cell 'Лист1'.C1>),
 (<Cell 'Лист1'.A2>, <Cell 'Лист1'.B2>, <Cell 'Лист1'.C2>),
 (<Cell 'Лист1'.A3>, <Cell 'Лист1'.B3>, <Cell 'Лист1'.C3>))
for row in sheet[1:3]:
    string = ''
    for cell in row:
        string = string + str(cell.value) + ' '
    print(string)
2015-04-05 13:34:02 Яблоки 73
2015-04-05 03:41:23 Вишни 85
2015-04-06 12:46:51 Груши 14
Для доступа к ячейкам конкретной строки или столбца также можно воспользоваться атрибутами rows и columns объекта Worksheet.
>>> list(sheet.rows)
[(<Cell 'Лист1'.A1>, <Cell 'Лист1'.B1>, <Cell 'Лист1'.C1>),
 (<Cell 'Лист1'.A2>, <Cell 'Лист1'.B2>, <Cell 'Лист1'.C2>),
 ..........
 (<Cell 'Лист1'.A6>, <Cell 'Лист1'.B6>, <Cell 'Лист1'.C6>),
 (<Cell 'Лист1'.A7>, <Cell 'Лист1'.B7>, <Cell 'Лист1'.C7>)]
for row in sheet.rows:
    print(row)
(<Cell 'Лист1'.A1>, <Cell 'Лист1'.B1>, <Cell 'Лист1'.C1>)
(<Cell 'Лист1'.A2>, <Cell 'Лист1'.B2>, <Cell 'Лист1'.C2>)
..........
(<Cell 'Лист1'.A6>, <Cell 'Лист1'.B6>, <Cell 'Лист1'.C6>)
(<Cell 'Лист1'.A7>, <Cell 'Лист1'.B7>, <Cell 'Лист1'.C7>)
>>> list(sheet.columns)
[(<Cell 'Лист1'.A1>, <Cell 'Лист1'.A2>, <Cell 'Лист1'.A3>, <Cell 'Лист1'.A4>, ..., <Cell 'Лист1'.A7>),
 (<Cell 'Лист1'.B1>, <Cell 'Лист1'.B2>, <Cell 'Лист1'.B3>, <Cell 'Лист1'.B4>, ..., <Cell 'Лист1'.B7>),
 (<Cell 'Лист1'.C1>, <Cell 'Лист1'.C2>, <Cell 'Лист1'.C3>, <Cell 'Лист1'.C4>, ..., <Cell 'Лист1'.C7>)]
for column in sheet.columns:
    print(column)
(<Cell 'Лист1'.A1>, <Cell 'Лист1'.A2>, <Cell 'Лист1'.A3>, <Cell 'Лист1'.A4>, ..., <Cell 'Лист1'.A7>)
(<Cell 'Лист1'.B1>, <Cell 'Лист1'.B2>, <Cell 'Лист1'.B3>, <Cell 'Лист1'.B4>, ..., <Cell 'Лист1'.B7>)
(<Cell 'Лист1'.C1>, <Cell 'Лист1'.C2>, <Cell 'Лист1'.C3>, <Cell 'Лист1'.C4>, ..., <Cell 'Лист1'.C7>)
Выводим значения всех ячеек листа:
for row in sheet.rows:
    string = ''
    for cell in row:
        string = string + str(cell.value) + ' '
    print(string)
2015-04-05 13:34:02 Яблоки 73
2015-04-05 03:41:23 Вишни 85
2015-04-06 12:46:51 Груши 14
2015-04-08 08:59:43 Апельсины 52
2015-04-10 02:07:00 Яблоки 152
2015-04-10 18:10:37 Бананы 23
2015-04-10 02:40:46 Земляника 98
Выводим значения второй строки (индекс 1):
for cell in list(sheet.rows)[1]:
    print(str(cell.value))
2015-04-05 03:41:23
Вишни
85
Выводим значения второй колонки (индекс 1):
for row in sheet.rows:
    print(str(row[1].value))
Яблоки
Вишни
Груши
Апельсины
Яблоки
Бананы
Земляника
Запись файлов Excel
>>> import openpyxl
>>> wb = openpyxl.Workbook()
>>> wb.sheetnames
['Sheet']
>>> wb.create_sheet(title = 'Первый лист', index = 0)
<Worksheet "Первый лист">
>>> wb.sheetnames
['Первый лист', 'Sheet']
>>> wb.remove(wb['Первый лист'])
>>> wb.sheetnames
['Sheet']
>>> wb.save('example.xlsx')
Метод create_sheet() возвращает новый объект Worksheet, который по умолчанию становится последним листом книги. С помощью именованных аргументов title и index можно задать имя и индекс нового листа.
Метод remove() принимает в качестве аргумента не строку с именем листа, а объект Worksheet. Если известно только имя листа, который надо удалить, используйте wb[sheetname]. Еще один способ удалить лист — использовать инструкцию del wb[sheetname].
Не забудьте вызвать метод save(), чтобы сохранить изменения после добавления или удаления листа рабочей книги.
Запись значений в ячейки напоминает запись значений в ключи словаря:
>>> import openpyxl
>>> wb = openpyxl.Workbook()
>>> wb.create_sheet(title = 'Первый лист', index = 0)
>>> sheet = wb['Первый лист']
>>> sheet['A1'] = 'Здравствуй, мир!'
>>> sheet['A1'].value
'Здравствуй, мир!'
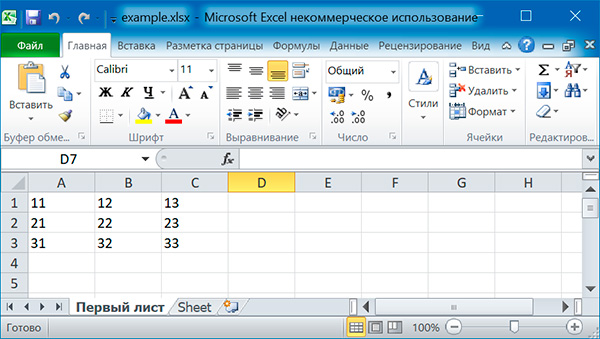
Заполняем таблицу 3×3:
import openpyxl

# создаем новый excel-файл
wb = openpyxl.Workbook()

# добавляем новый лист
wb.create_sheet(title = 'Первый лист', index = 0)

# получаем лист, с которым будем работать
sheet = wb['Первый лист']

for row in range(1, 4):
    for col in range(1, 4):
        value = str(row) + str(col)
        cell = sheet.cell(row = row, column = col)
        cell.value = value

wb.save('example.xlsx')
Можно добавлять строки целиком:
sheet.append(['Первый', 'Второй', 'Третий'])
sheet.append(['Четвертый', 'Пятый', 'Шестой'])
sheet.append(['Седьмой', 'Восьмой', 'Девятый'])
Стилевое оформление
Для настройки шрифтов, используемых в ячейках, необходимо импортировать функцию Font() из модуля openpyxl.styles:
from openpyxl.styles import Font
Ниже приведен пример создания новой рабочей книги, в которой для шрифта, используемого в ячейке A1, устанавливается шрифт Arial, красный цвет, курсивное начертание и размер 24 пункта:
import openpyxl
from openpyxl.styles import Font

# создаем новый excel-файл
wb = openpyxl.Workbook()
# добавляем новый лист
wb.create_sheet(title = 'Первый лист', index = 0)
# получаем лист, с которым будем работать
sheet = wb['Первый лист']

font = Font(name='Arial', size=24, italic=True, color='FF0000')
sheet['A1'].font = font
sheet['A1'] = 'Здравствуй мир!'

# записываем файл
wb.save('example.xlsx')
Именованные стили применяются, когда надо применить стилевое оформление к большому количеству ячеек.
import openpyxl
from openpyxl.styles import NamedStyle, Font, Border, Side

# создаем новый excel-файл
wb = openpyxl.Workbook()
# добавляем новый лист
wb.create_sheet(title = 'Первый лист', index = 0)
# получаем лист, с которым будем работать
sheet = wb['Первый лист']

# создаем именованный стиль
ns = NamedStyle(name='highlight')
ns.font = Font(bold=True, size=20)
border = Side(style='thick', color='000000')
ns.border = Border(left=border, top=border, right=border, bottom=border)

# вновь созданный именованный стиль надо зарегистрировать
# для дальнейшего использования
wb.add_named_style(ns)

# теперь можно использовать именованный стиль
sheet['A1'].style = 'highlight'

# записываем файл
wb.save('example.xlsx')
Добавление формул
Формулы, начинающиеся со знака равенства, позволяют устанавливать для ячеек значения, рассчитанные на основе значений в других ячейках.
sheet['B9'] = '=SUM(B1:B8)'
Эта инструкция сохранит =SUM(B1:B8) в качестве значения в ячейке B9. Тем самым для ячейки B9 задается формула, которая суммирует значения, хранящиеся в ячейках от B1 до B8.
Формула Excel — это математическое выражение, которое создается для вычисления результата и которое может зависеть от содержимого других ячеек. Формула в ячейке Excel может содержать данные, ссылки на другие ячейки, а также обозначение действий, которые необходимо выполнить.
Использование ссылок на ячейки позволяет пересчитывать результат по формулам, когда происходят изменения содержимого ячеек, включенных в формулы. Формулы Excel начинаются со знака =. Скобки () могут использоваться для определения порядка математических операции.
Примеры формул Excel: =27+36, =А1+А2-АЗ, =SUM(А1:А5), =MAX(АЗ:А5), =(А1+А2)/АЗ.
Хранящуюся в ячейке формулу можно читать, как любое другое значение. Однако, если нужно получить результат расчета по формуле, а не саму формулу, то при вызове функции load_workbook() ей следует передать именованный аргумент data_only со значением True.
Настройка строк и столбцов
С помощью модуля OpenPyXL можно задавать высоту строк и ширину столбцов таблицы, закреплять их на месте (чтобы они всегда были видны на экране), полностью скрывать из виду, объединять ячейки.
Настройка высоты строк и ширины столбцов
Объекты Worksheet имеют атрибуты row_dimensions и column_dimensions, которые управляют высотой строк и шириной столбцов.
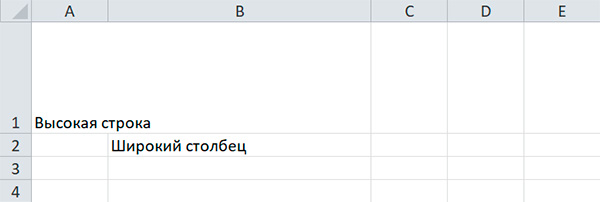
sheet['A1'] = 'Высокая строка'
sheet['B2'] = 'Широкий столбец'

sheet.row_dimensions[1].height = 70
sheet.column_dimensions['B'].width = 30
Атрибуты row_dimensions и column_dimensions представляют собой значения, подобные словарю. Атрибут row_dimensions содержит объекты RowDimensions, а атрибут column_dimensions содержит объекты ColumnDimensions. Доступ к объектам в row_dimensions осуществляется с использованием номера строки, а доступ к объектам в column_dimensions — с использованием буквы столбца.
Для указания высоты строки разрешено использовать целые или вещественные числа в диапазоне от 0 до 409. Для указания ширины столбца можно использовать целые или вещественные числа в диапазоне от 0 до 255. Столбцы с нулевой шириной и строки с нулевой высотой невидимы для пользователя.
Объединение ячеек
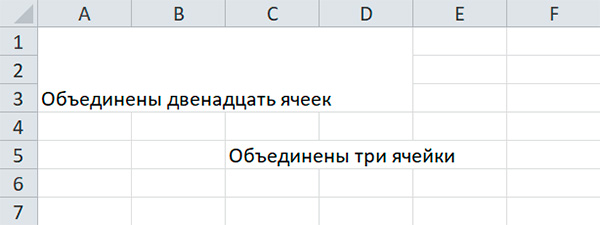
Ячейки, занимающие прямоугольную область, могут быть объединены в одну ячейку с помощью метода merge_cells() рабочего листа:
sheet.merge_cells('A1:D3')
sheet['A1'] = 'Объединены двенадцать ячеек'

sheet.merge_cells('C5:E5')
sheet['C5'] = 'Объединены три ячейки'
Чтобы отменить слияние ячеек, надо вызвать метод unmerge_cells():
sheet.unmerge_cells('A1:D3')
sheet.unmerge_cells('C5:E5')
Закрепление областей
Если размер таблицы настолько велик, что ее нельзя увидеть целиком, можно заблокировать несколько верхних строк или крайних слева столбцов в их позициях на экране. В этом случае пользователь всегда будет видеть заблокированные заголовки столбцов или строк, даже если он прокручивает таблицу на экране.
У объекта Worksheet имеется атрибут freeze_panes, значением которого может служить объект Cell или строка с координатами ячеек. Все строки и столбцы, расположенные выше и левее, будут заблокированы.
| Значение атрибута freeze_panes | Заблокированные строки и столбцы |
|---|---|
sheet.freeze_panes = 'A2' |
Строка 1 |
sheet.freeze_panes = 'B1' |
Столбец A |
sheet.freeze_panes = 'C1' |
Столбцы A и B |
sheet.freeze_panes = 'C2' |
Строка 1 и столбцы A и B |
sheet.freeze_panes = None |
Закрепленные области отсутствуют |
Диаграммы
Модуль OpenPyXL поддерживает создание гистогорамм, графиков, а также точечных и круговых диаграмм с использование данных, хранящихся в электронной таблице. Чтобы создать диаграмму, необходимо выполнить следующие действия:
- создать объект
Referenceна основе ячеек в пределах выделенной прямоугольной области; - создать объект
Series, передав функцииSeries()объектReference; - создать объект Chart;
- дополнительно можно установить значения переменных
drawing.top,drawing.left,drawing.width,drawing.heightобъектаChart, определяющих положение и размеры диаграммы; - добавить объект
Chartв объектWorksheet.
Объекты Reference создаются путем вызова функции openpyxl.charts.Reference(), принимающей пять аргуменов:
- Объект
Worksheet, содержащий данные диаграммы. - Два целых числа, представляющих верхнюю левую ячейку выделенной прямоугольной области, в которых содержатся данные диаграммы: первое число задает строку, второе — столбец; первой строке соответствует 1, а не 0.
- Два целых числа, представляющих нижнюю правую ячейку выделенной прямоугольной области, в которых содержатся данные диаграммы: первое число задает строку, второе — столбец.
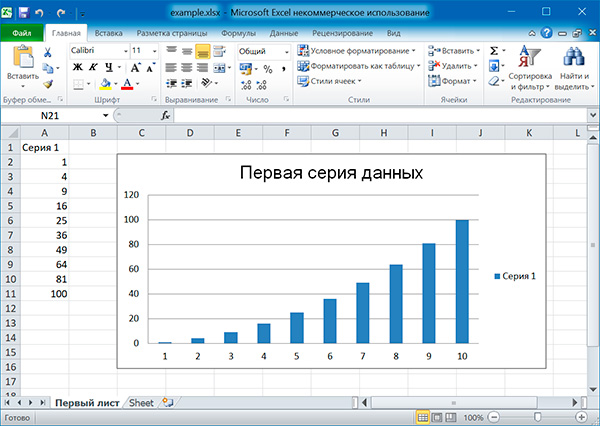
from openpyxl import Workbook
from openpyxl.chart import BarChart, Reference

# создаем новый excel-файл
wb = Workbook()
# добавляем новый лист
wb.create_sheet(title = 'Первый лист', index = 0)
# получаем лист, с которым будем работать
sheet = wb['Первый лист']

sheet['A1'] = 'Серия 1'
# это колонка с данными
for i in range(1, 11):
    cell = sheet.cell(row = i + 1, column = 1)
    cell.value = i * i

# создаем диаграмму
chart = BarChart()
chart.title = 'Первая серия данных'
data = Reference(sheet, min_col = 1, min_row = 1, max_col = 1, max_row = 11)
chart.add_data(data, titles_from_data = True)

# добавляем диаграмму на лист
sheet.add_chart(chart, 'C2')

# записываем файл
wb.save('example.xlsx')
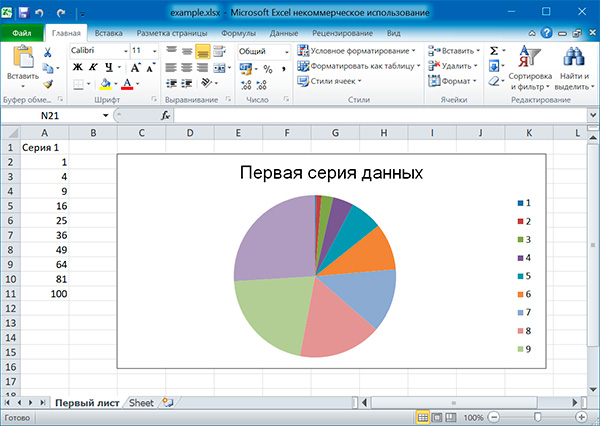
Аналогично можно создавать графики, точечные и круговые диаграммы, вызывая методы:
openpyxl.chart.LineChart()openpyxl.chart.ScatterChart()openpyxl.chart.PieChart()
Поиск:
Excel • MS • Python • Web-разработка • Модуль