
«Hello, I am new to SQL. We use SQL query in SQL 2016 Server. And then we are exporting the output to excel. Could you please guide me on how to make the process automated for exporting data from SQL to Excel. Since I don’t want to do the task manually any longer. «
If you come across the same problem as mentioned above and want to find a way to export SQL Server data to Excel, don’t fret. This page covers two possible ways to help you export data from SQL Server automatically.
Two Ways to Export Data from SQL Server to Excel
You can use the SQL Server Import and Export Wizard and Data Connection Wizard in Excel to export data from SQL Server to Excel. See the details below.
Solution 1. Use the SQL Server Import and Export Wizard
1. Open SQL Server Management Studio and connect to the database.
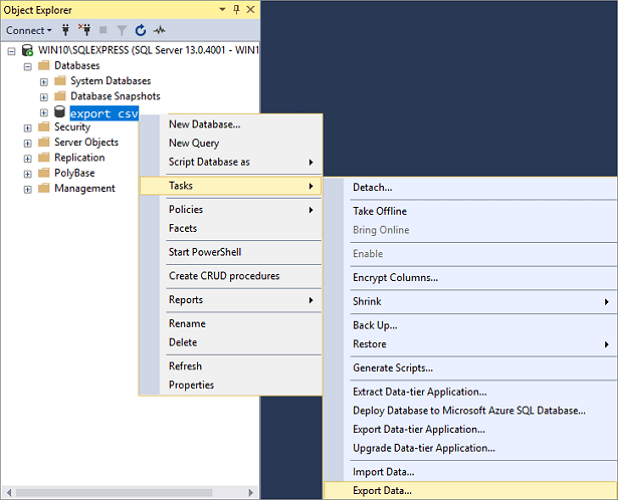
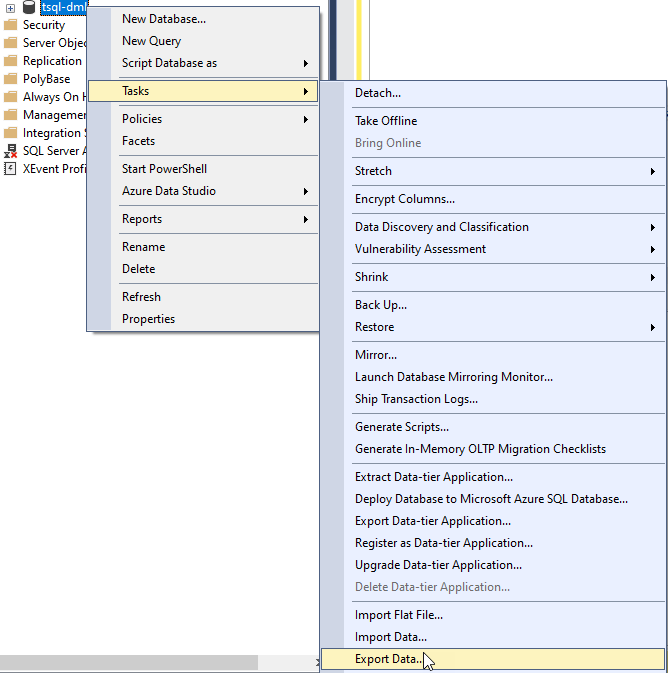
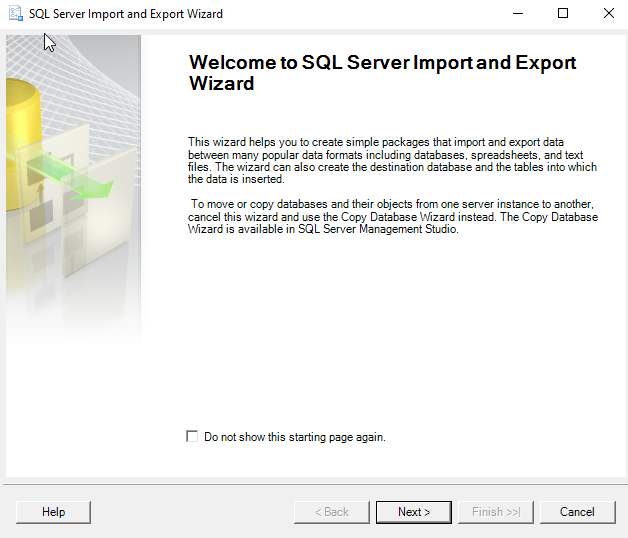
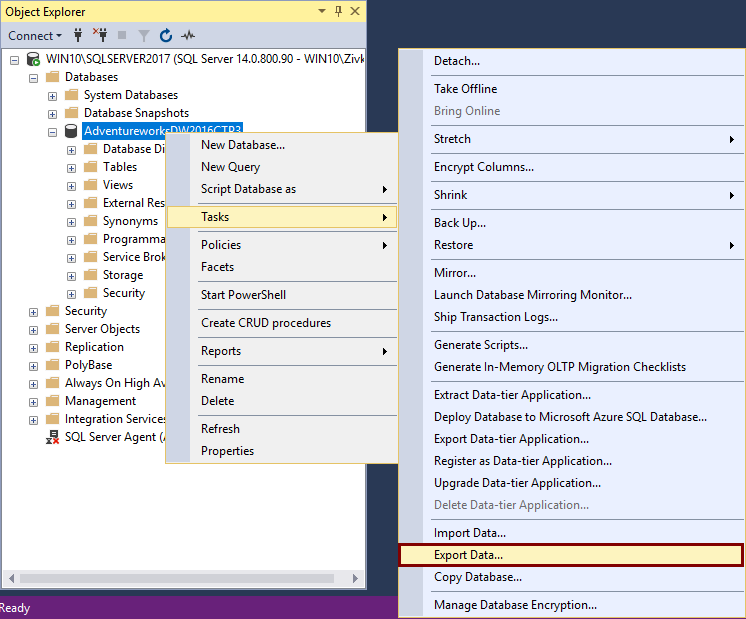
2. Go to «Object Explorer», find the server database you want to export to Excel. Right-click on it and choose «Tasks» > «Export Data» to export table data in SQL. Then, the SQL Server Import and Export Wizard welcome window pop up.
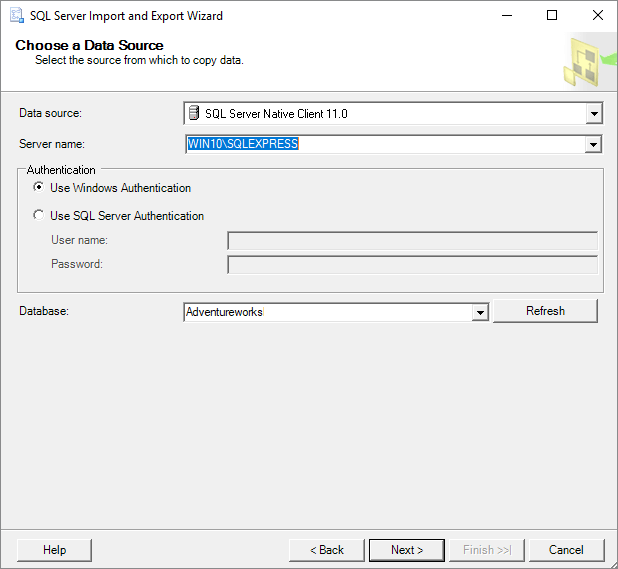
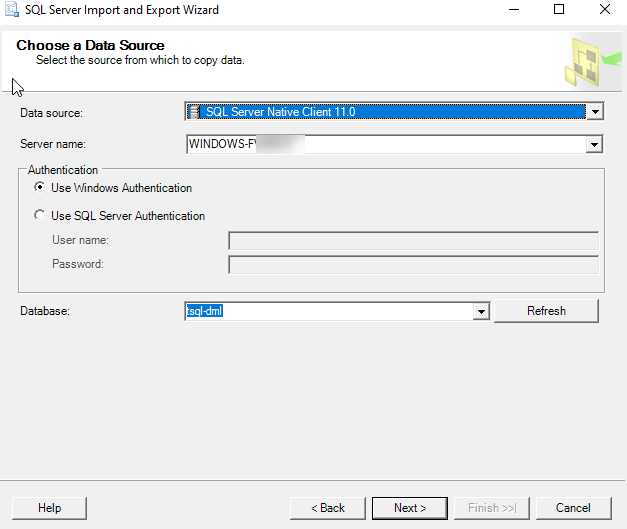
3. Now, you need to click on the Data source drop-down button to choose the data source you want to copy. Here, select «SQL Server Native Client 11.0». In the Server name drop-down box, select a SQL Server instance. In the Authentication section, choose authentication for the data source connection and from the Database drop-down box, select a database from which data will be copied. After everything is set, press the «Next» button.
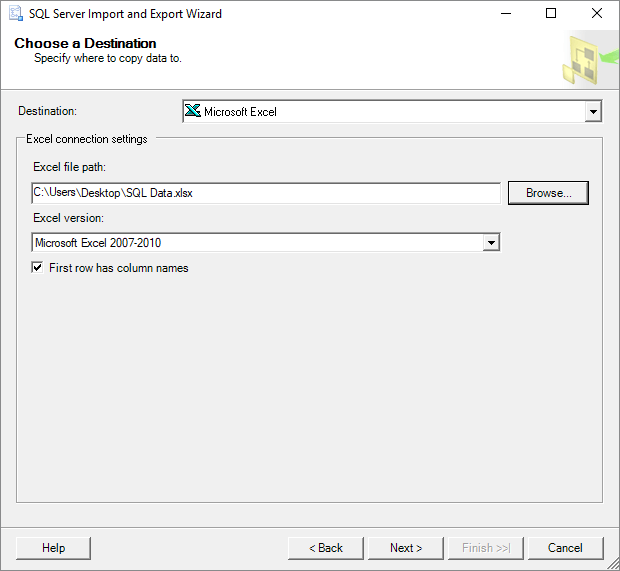
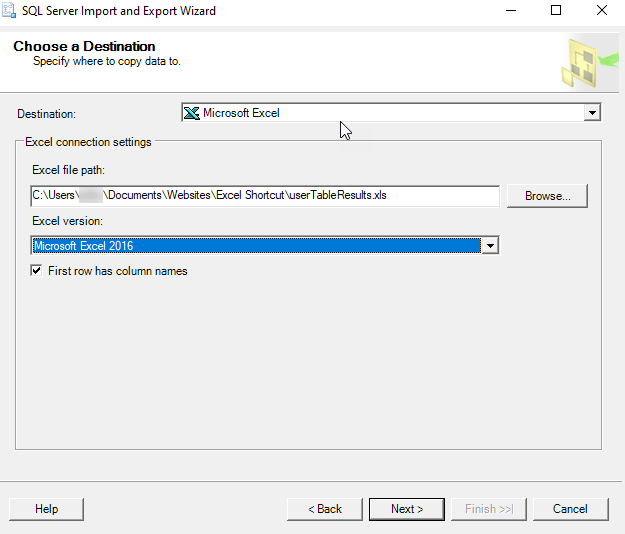
4. On the «Choose a Destination» window, in the Destination box, choose Microsoft Excel item for exporting data from SQL Server to Excel. Choose the Excel file path and version as you need. Then, click the «Next» button to continue.
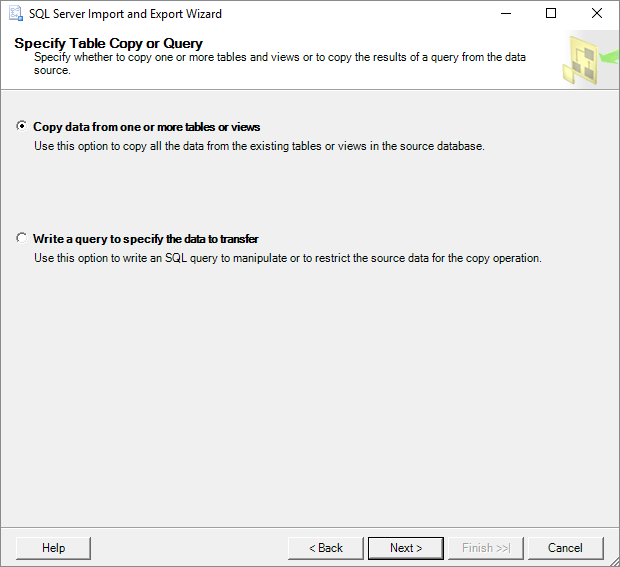
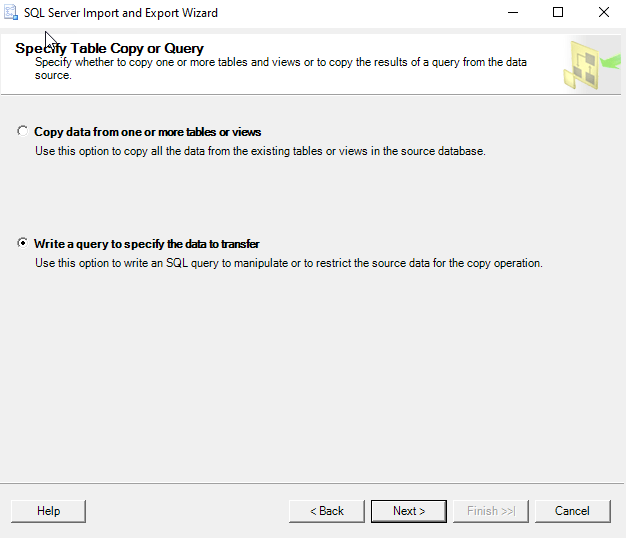
5. On the Specify Table Copy or Query screen, you can choose «Copy data from one or more tables or views». Then, click «Next» to go on.
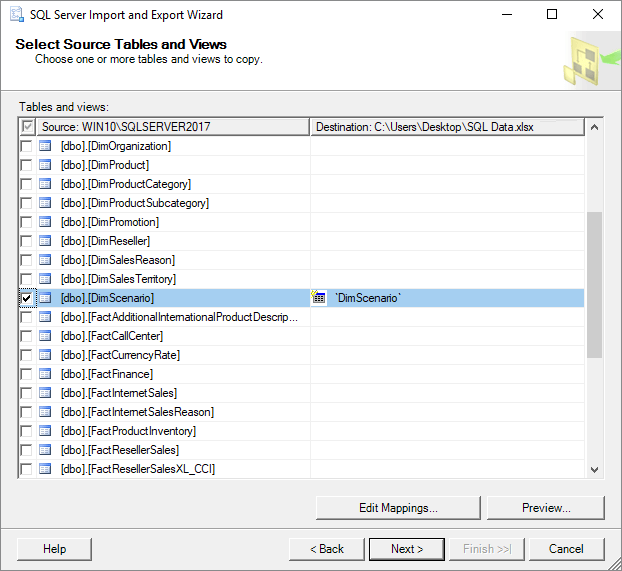
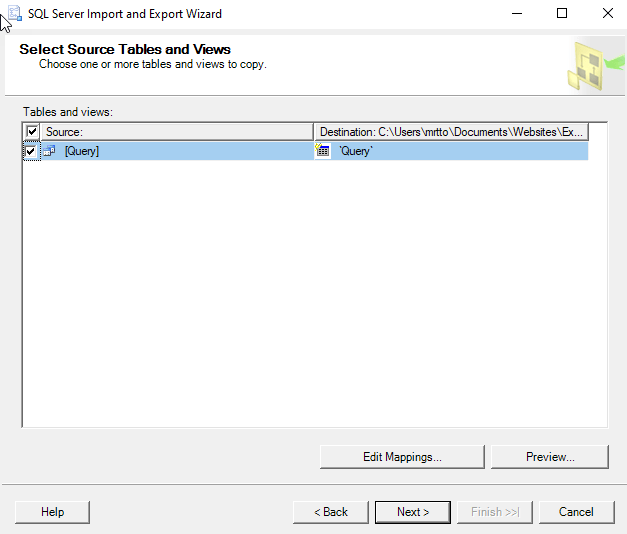
6. In the «Select Source Table and Views» window, you can choose one or more tables and views from which you want to export SQL Server data to an Excel. Click the «Preview» button to preview which data will be generated to an Excel file. Click the «Next» button to move on.
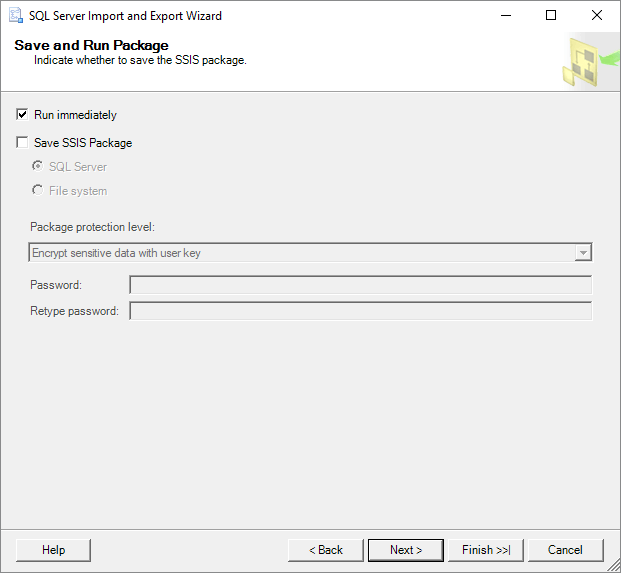
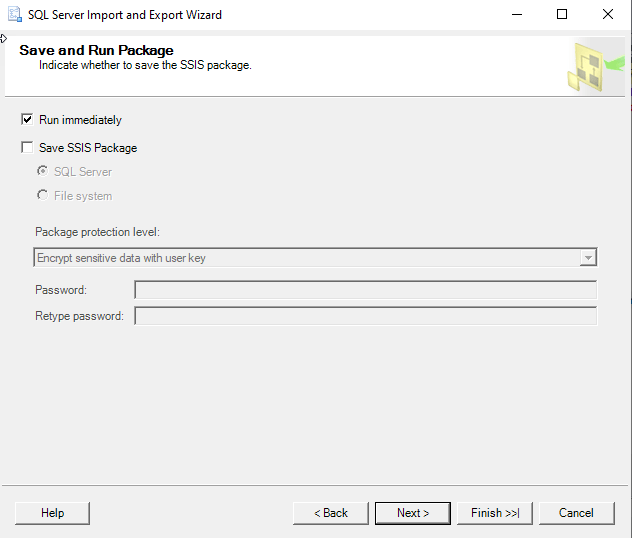
7. Here, on the «Save and Run Package» window, check the «Run immediately» and click the «Next» button.
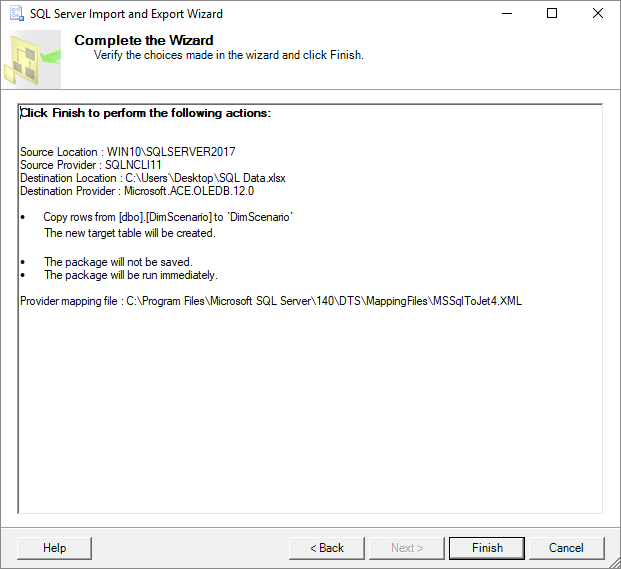
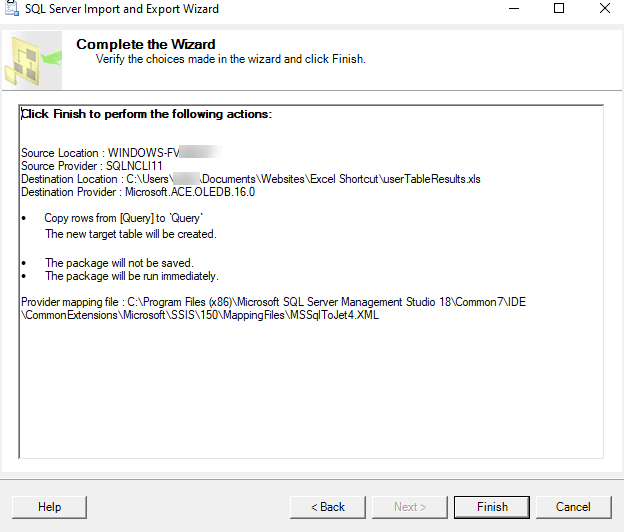
8. On the «Complete» Wizard window, you can check all the settings set during of exporting process. If everything is right, click «Finish» to start exporting SQL database to Excel.
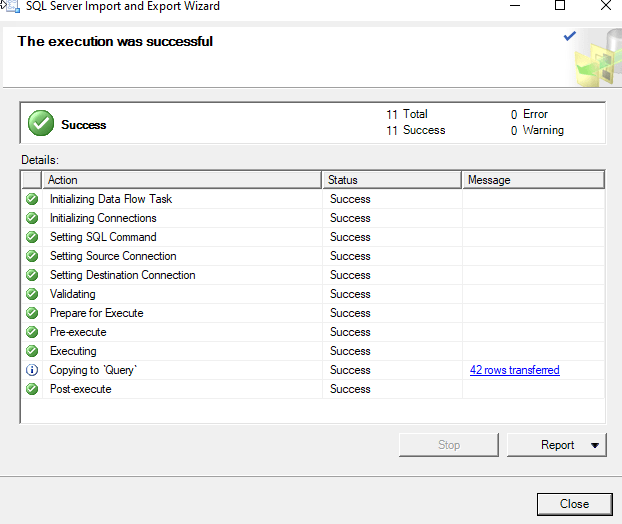
9. You can view the exporting process in this step. When it completes, click on «Report» drop-down button.
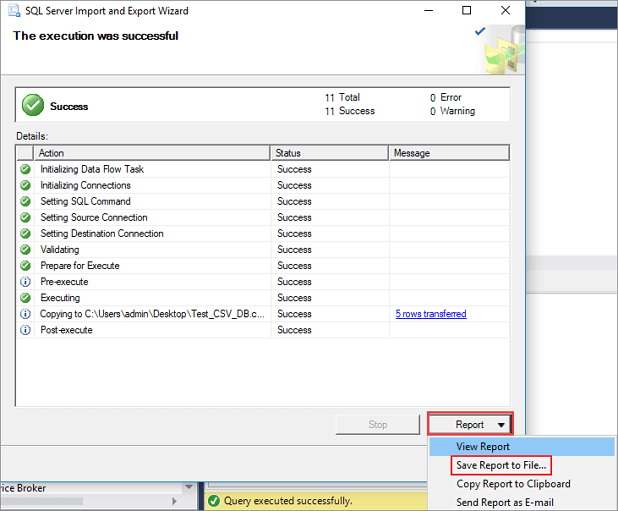
10. You can choose «Save Report to File…» (including Excel, Notepad) to save the report. Here, you need to choose Excel as the target file format.
How to Repair SQL Server Database
SQL Server Management Studio (SSMS) offers the Import and Export Wizard feature to export data from one data source to another data source. Namely, you can apply this function to export SQL to Excel. For exporting SQL Server database to CSV, link to check the details.
Step 1. Close the SQL Service in Task Manager or SQL Server Manager Console.
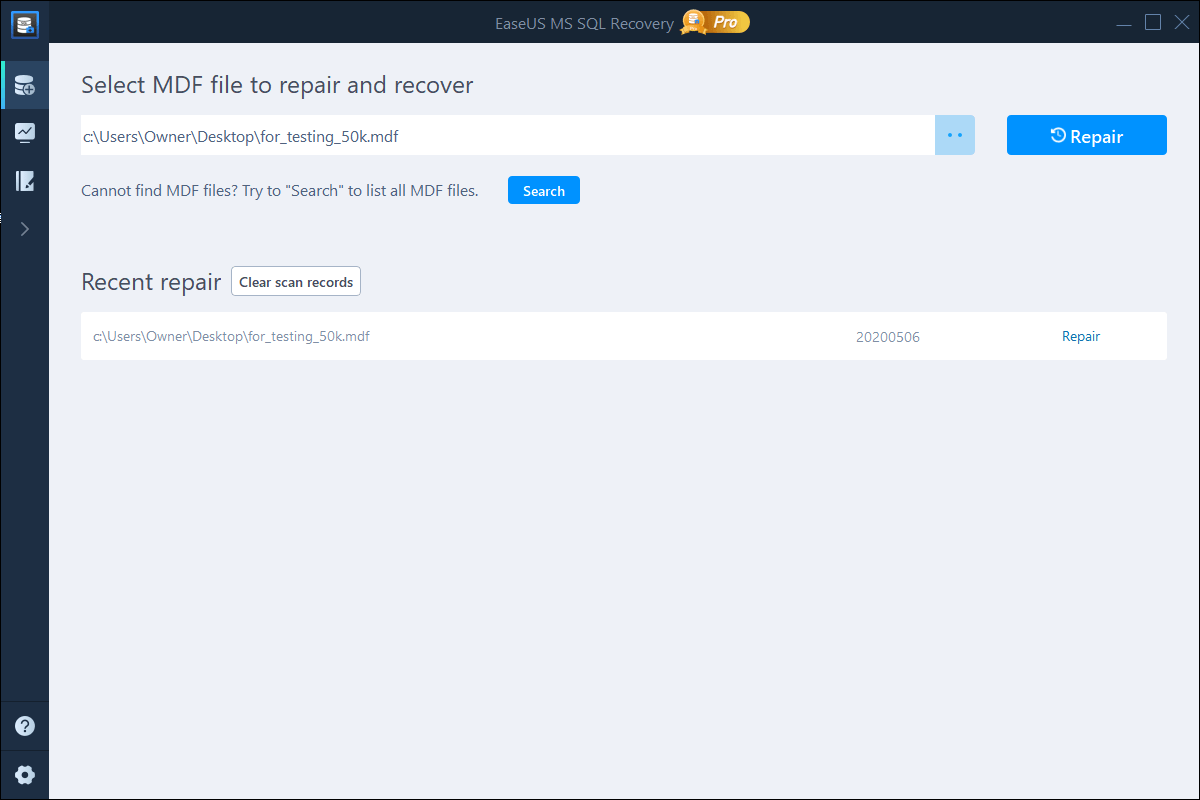
Step 2. Run EaseUS MS SQL Recovery, click «Browse» (the two dots) or «Search» to choose the location where you saved your corrupted database. Afterward, Click «Repair» to start analyzing the specified database.
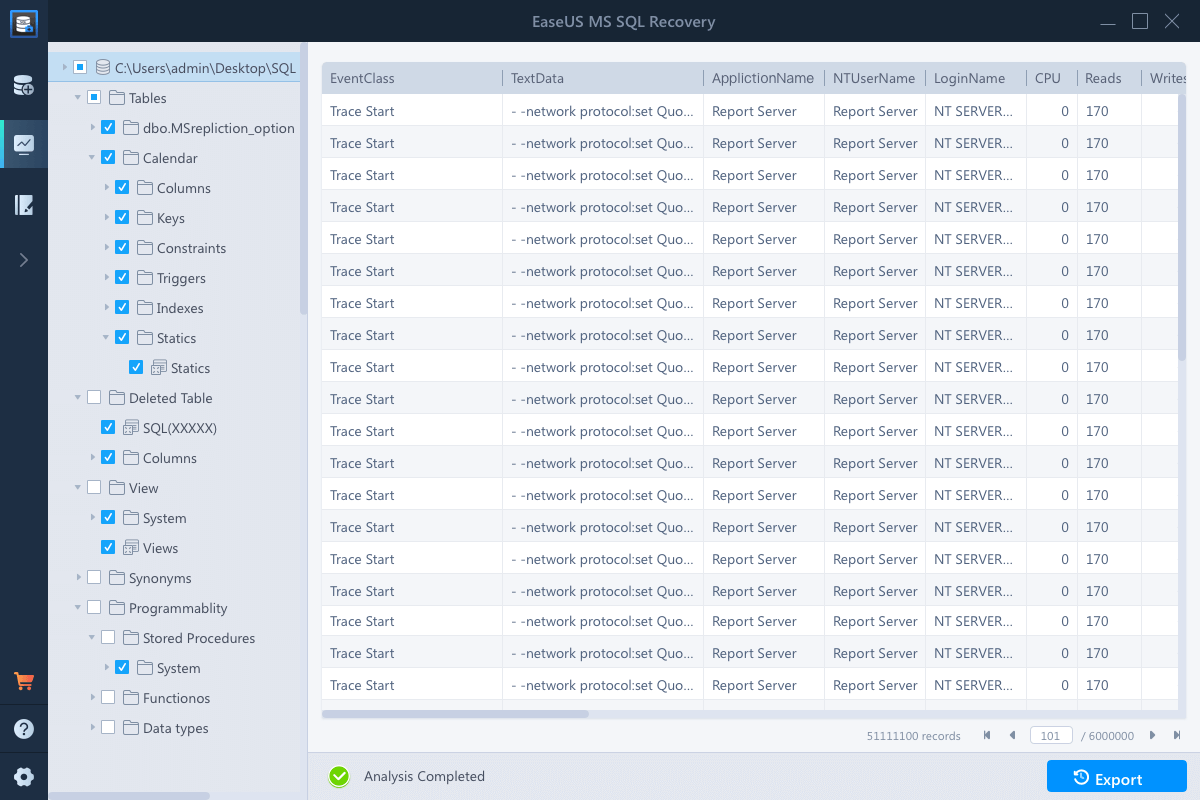
Step 3. When it has done, choose the files you want to repair and click «Export».
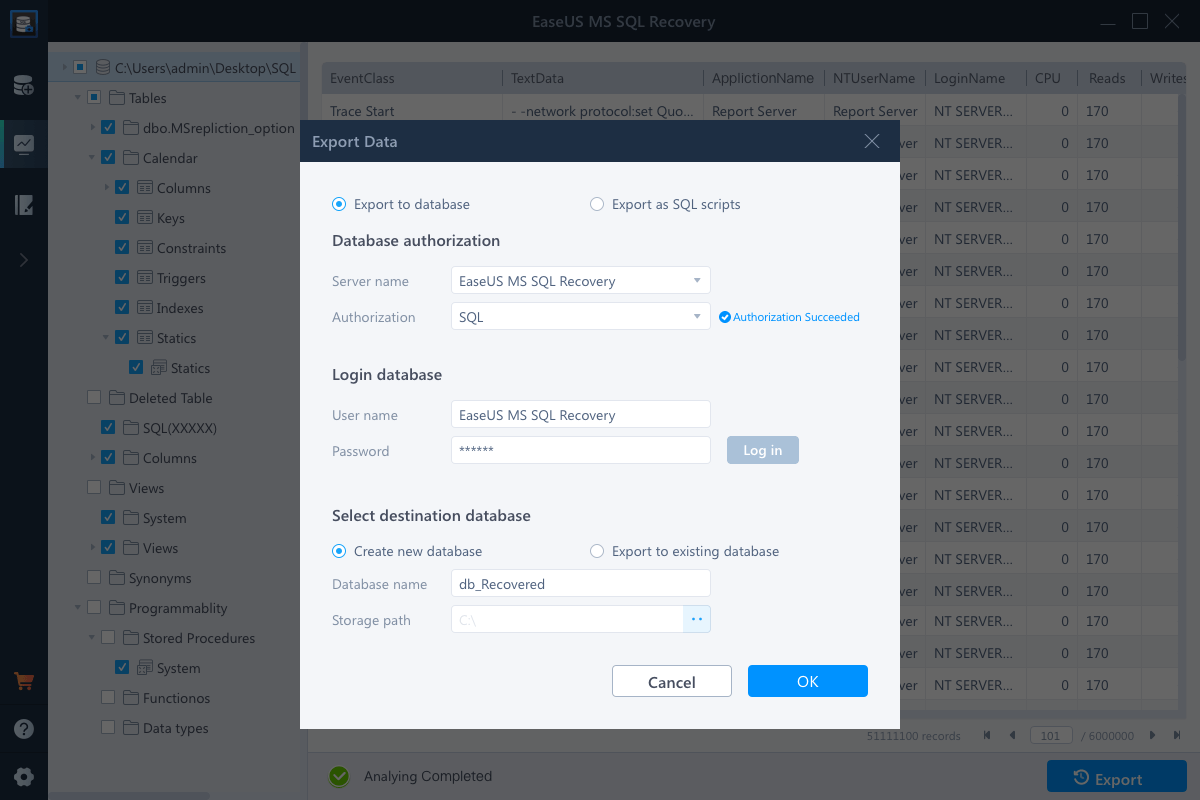
Step 4. Turn on the SQL service, you can choose to export the repaired files to database to export it as SQL scripts.
Solution 2. Using the Data Connection Wizard in Excel
Another way to export data from SQL Server to Excel file is to use the Data Connection Wizard dialog in Excel.
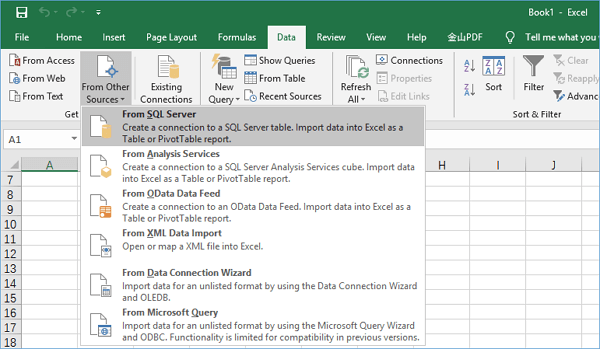
1. Launch Excel, open an Excel file in which you want to export SQL Server data. On the toolbar, click the «Data» tab > select «From Other Sources» > choose «From SQL Server».
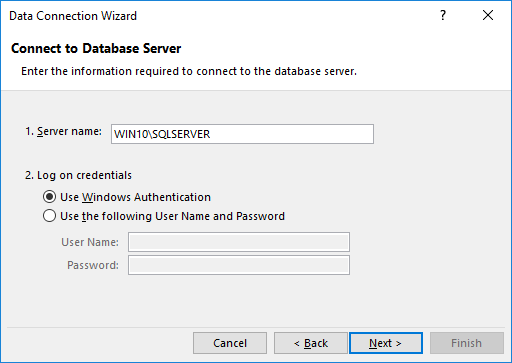
2. The «Data Connection Wizard» window will pop up. Enter the name of the SQL Server instance from which data need to export. In the «Log on credentials» section, choose «Use Windows Authentication» mode for the data source connection and click the «Next» button.
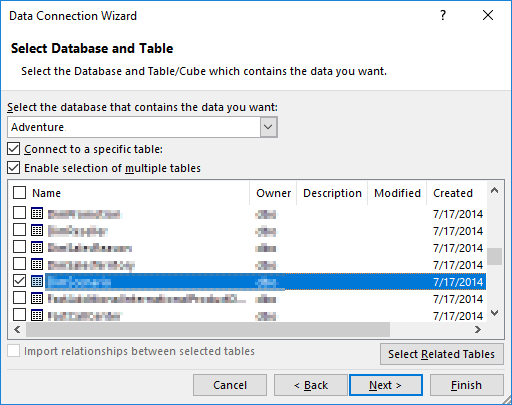
3. Choose the database from which the data will be exported. And click the «Next» button to proceed. On the next window, leave everything as it is and press the «Finish» button.
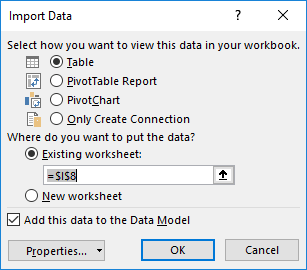
4. In the Import Data dialog, choose «Table» and «Existing worksheet» as the screenshot shows. Press the «OK» button. After this, the SQL Server data will be exported to Excel file.
Export SQL Data to Excel from Microsoft SQL Server
Let’s go over three ways to export an SQL Query to an Excel File Using MSSQL
Despite the pushback from Database aficionados, sometimes it makes sense to export data from SQL to an Excel file. It really depends on who is the audience of the information. Not everyone is great with SQL Analysis. Few people require access to the database.
And lots of times the boss just needs to see the information in Excel.
So, if Excel is the Output required this article is here to help you Export SQL Queries to Excel.
Here are three ways to Export a SQL query to Excel format. The last one can be kind of tricky. I’ll provide a condensed version followed by a detailed version with screenshots.
Three quick ways to Export SQL Data to Excel:
Choose the Summarized Version and then scroll to further down to use the SQL Export Version to Excel that works best for you.
Method Number 1 – Copy Grid results and Paste into Excel
Under Query, Make sure results to Grid are selected.
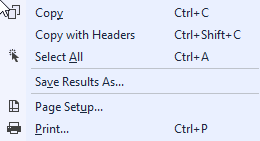
After Running your query, right-click the top right corner of the grid.
Copy With Headers.
Paste into an Excel File
Possible Issues:
I’ve seen formatting issues with this strategy. For Example, there are situations where the spreadsheet drops preceding zeroes after the copy-paste.
I’ve also noticed lengthy fields, (think of a really long free text field) end up running into the next line.
For the reasons above, I prefer this next method for a clean Excel file.
Method Number 2: Export the Query Results as a Task
In the object explorer window, find the database you want to export from.
Right Click the Database, Click Tasks, and Export Data
The Wizard walks you through the rest of the steps but I have included screenshots below.
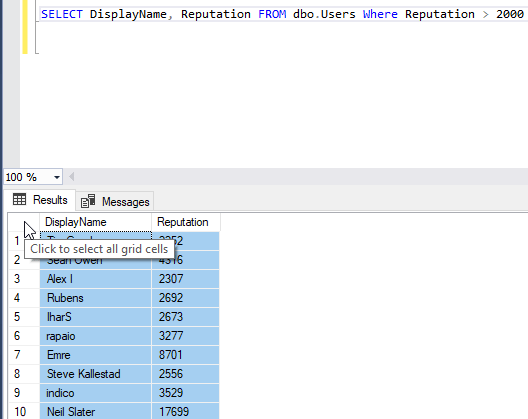
Method Number 3 – Use Good Old fashioned TSQL to send the data to an excel file
For those who value speed above all use the following script format.
INSERT INTO OPENROWSET(‘Microsoft.ACE.OLEDB.12.0′,’Excel 12.0; Database=C:SQL2019ReportsUsernames.xlsx;’,’SELECT * FROM [Sheet1$]’) SELECT DisplayName FROM dbo.Users Where Reputation > 2000
Possible Issues – Configuring this might not be your type of fun and getting this straight deserves its own article.
Step by Step instructions with screenshots
Method Number 1 – Copy Grid results and paste into Excel
After ensuring results to grid turned on, Execute your query, right-click the top left-hand corner of the results grid.
Choose Copy with Headers and then you are ready to paste in Excel with Ctrl + C
Method 2 – Export Via the Export Wizard
Right-click on the database you want to export from. Then Select tasks and “Export Data”.
The SQL Server Wizard will startup. Click Next through the prompts.
Select the appropriate Native client, your server name, and database and choose “Next”.
Next, Select Microsoft Excel and the file path where you want to import the data. The .xls file that you name will be created by this process.
Now you can choose to export a whole table or a query. For the purpose of this exercise, we are creating a query.
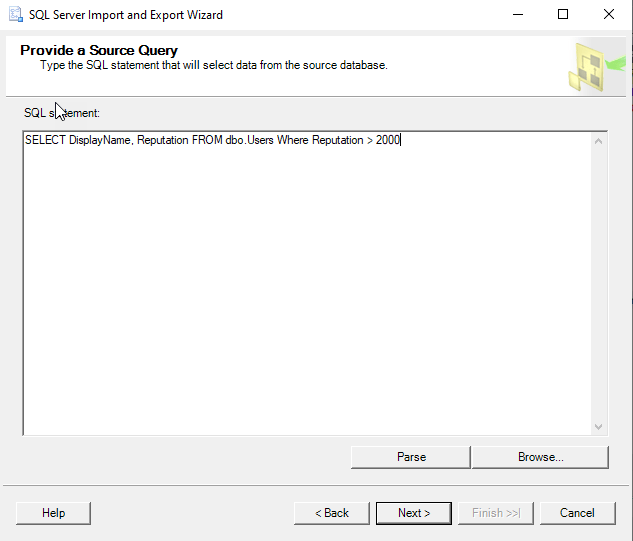
Paste the query into the SQL Statement field. Make sure every output field has a unique name.
Click Next on the “Select Source Tables and Views” screen.
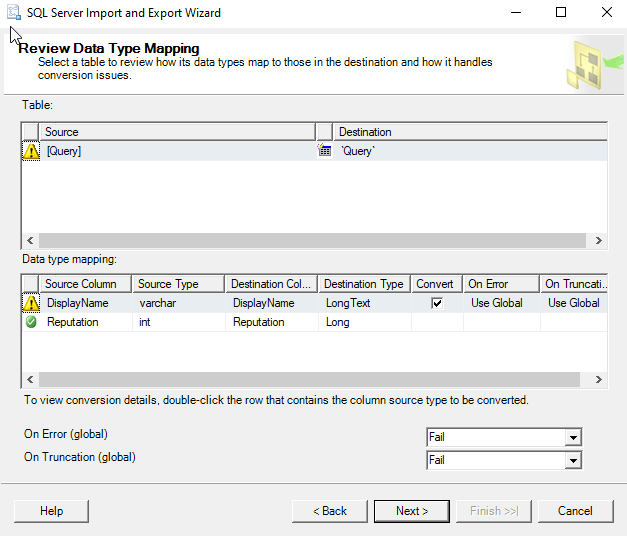
I use the default settings on the “conversion issues and data type mapping screen”
Now you can choose to Run immediately or Save an SSIS Package for later reuse.
Double Check your settings and click finish.
Make sure there were no errors in the Export.
Now Go to the directory you choose earlier and make sure you have a sweet-looking Excel File at that location!
Method Number 3 – Use TSQL to send the data to an excel file
This method is the quickest once you get it set up but the configuration is the tricky part. Permissions can be a limiting factor.
Also with the script below, you have to make sure the file exists before you run the query for it to import properly.
First, create a blank excel file at the directory of your choosing.
C:SQL2019ReportsUsernames.xlsx
Then run this script below.
INSERT INTO OPENROWSET(‘Microsoft.ACE.OLEDB.12.0’,’Excel 12.0;
Database=C:SQL2019ReportsUsernames.xlsx;’,’SELECT * FROM [Sheet1$]’)
SELECT DisplayName FROM dbo.Users Where Reputation > 2000

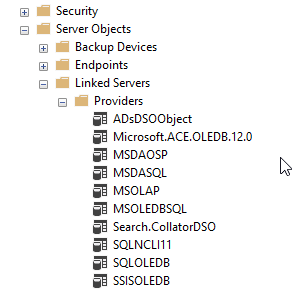
Configuring this can be tricky and dependent on your level of permissions. Make sure you have the correct Linked Server/Provider installed (‘Microsoft.ACE.OLEDB.12.0’) And check your Database user settings to this server .
| title | description | author | ms.author | ms.date | ms.service | ms.subservice | ms.topic | ms.custom |
|---|---|---|---|---|---|---|---|---|
|
Export a paginated report to Microsoft Excel (Report Builder) |
In Report Builder, the Excel rendering extension renders a paginated report to the Office Open XML format to use with Microsoft Excel. |
maggiesMSFT |
maggies |
03/24/2023 |
reporting-services |
report-builder |
conceptual |
updatefrequency5 |
Export a paginated report to Microsoft Excel (Report Builder)
[!INCLUDEssrs-appliesto] [!INCLUDE ssrs-appliesto-ssrs-rb] [!INCLUDE ssrs-appliesto-pbi-rb] [!INCLUDE ssrb-applies-to-ssdt-yes]
The Excel rendering extension renders a paginated report to the [!INCLUDEofprexcel] format (.xlsx). With the Excel rendering extension, the width of columns in Excel more accurately reflects the width of columns in reports.
The format is Office Open XML. The content type of files generated by this renderer is application/vnd.openxmlformats-officedocument.spreadsheetml.sheet and the file extension is .xlsx.
You can change some default settings for this renderer by changing the device information settings. For more information, see Excel Device Information Settings.
See Export Reports (Report Builder and SSRS) for details on how to export to Excel.
[!IMPORTANT]
When you define a parameter of type String, the user is presented with a text box that can take any value. If a report parameter is not tied to a query parameter and the parameter values are included in the report, it is possible for a report user to type expression syntax, script, or a URL into the parameter value, and render the report to Excel. If another user then views the report and clicks the rendered parameter contents, the user may inadvertently execute the malicious script or link.To mitigate the risk of inadvertently running malicious scripts, open rendered reports only from trusted sources. For more information about securing reports, see Secure Reports and Resources.
Excel Limitations
[!INCLUDEofprexcel] places limitations on exported reports due to the capabilities of Excel and its file formats. The most significant are the following:
-
The maximum column width is limited to 255 characters or 1726.5 points. The renderer does not verify that the column width is less than the limit.
-
The maximum number of characters in a cell is limited to 32,767. If this is exceeded, the renderer displays an error message.
-
The maximum row height is 409 points. If the contents of the row cause the row height to increase beyond 409 points, the Excel cell shows a partial amount of text up to 409 points. The rest of the cell contents is still within the cell (up to Excel’s max number of characters of 32,767).
-
Because the maximum row height is 409 points, if the defined height of the cell in the report is something larger than 409 points, Excel splits the cell contents into multiple rows.
-
The maximum number of worksheets is not defined in Excel, but external factors, such as memory and disk space, might cause limitations to be applied.
-
In outlines, Excel permits up to seven nested levels only.
-
If the report item that controls whether another item is toggled is not in the previous or next row or column of the item being toggled, the outline is disabled also.
For more details about Excel limitations, see Excel specifications and limits.
Sizes of Excel 2003 (.xls) Files
[!IMPORTANT]
The [!INCLUDEofprexcel] 2003 rendering extension is deprecated. For more information, see Deprecated Features in SQL Server Reporting Services in SQL Server 2016.
When reports are first exported and saved to Excel 2003, they do not benefit from the file optimization that Excel automatically applies to its *.xls workbook files. The larger file size can cause problems for e-mail subscriptions and attachments. To reduce the size of the *.xls files for exported reports, open the *.xls files and then resave the workbooks. Resaving the workbooks typically reduces their file sizes by 40 to 50 percent.
[!NOTE]
In Excel 2003, approximately 1000 characters are displayed in an Excel cell on the worksheet but up to the maximum number of characters can be edited in the formula bar. This limitation does not apply to current (.xlsx) Excel files.
Text Boxes and Text
The following limitations apply to text boxes and text:
-
Text box values that are expressions are not converted to Excel formulas. The value of each text box is evaluated during report processing. The evaluated expression is exported as the contents of each Excel cell.
-
Text boxes are rendered within one Excel cell. Font size, font face, decoration, and font style are the only formatting that is supported on individual text within an Excel cell.
-
The text effect «Overline» is not supported in Excel.
-
Excel adds a default padding of approximately 3.75 points to the left and right sides of cells. If a text box’s padding settings are less than 3.75 points and is just barely wide enough to accommodate the text, the text may wrap in Excel.
[!NOTE]
To work around this issue, increase the width of the text box in the report.
Images
The following limitations apply to images:
-
Background images for report items are ignored because Excel does not support background images for individual cells.
-
The Excel rendering extension only supports the background image of the report body. If a report body background image is displayed in the report, the image is rendered as a worksheet background image.
Rectangles
The following limitation applies to rectangles.
- Rectangles in report footers are not exported to Excel. However, rectangles in the report body, tablix cells, and so forth are rendered as a range of Excel cells.
Report Headers and Footers
The following limitations apply to report headers and footers:
-
Excel headers and footers support a maximum of 256 characters including markup. The rendering extension truncates the string at 256 characters.
-
[!INCLUDEssRSnoversion] does not support margins on report headers and footers. When exported to Excel, these margin values are set to zero and any header or footer that contains multiple rows of data might not print multiple rows, depending on the printer settings.
-
Text boxes in a header or footer maintain their formatting but not their alignment when exported to Excel. This occurs because leading and trailing spaces are trimmed when the report is rendered to Excel.
Merging Cells
The following limitation applies to merging cells:
- If cells are merged, word-wrap does not work correctly. If any merged cells exist on a row where a text box is rendered with the AutoSize property, autosize will not work.
The Excel renderer is primarily a layout renderer. Its goal is to replicate the layout of the rendered report as closely as possibly in an Excel worksheet and consequently cells might be merged in the worksheet to preserve the report layout. Merged cells can cause problems because the sort functionality in Excel requires cells to be merged in a very specific way for sort to work properly. For example, Excel requires that the ranges of merged cells have the same size in order to be sorted.
If it is important that reports exported to Excel worksheets can be sorted, then the following can help you reduce the number of merged cells in your Excel worksheets, which is the common cause for difficulties with Excel sort functionality.
-
Not aligning items left and right is the most common cause of merged cells. Make sure the left and right edges of all report items line up with one another. Making items align and the same width will solve the problem in the majority of cases.
-
Although you align all items precisely, you might find in some rare cases that some columns continue to be merged. This could be caused by internal unit conversion and rounding when the Excel worksheet is rendered. In the report definition language (RDL), you can specify position and size in different measurement units such as inches, pixels, centimeters, and points. Internally the Excel uses points. To minimize conversion and the potential inaccuracy of rounding when converting inches and centimeters to points, consider specifying all measurements in whole points for the most direct results. One inch is 72 points.
Report Row Groups and Column Groups
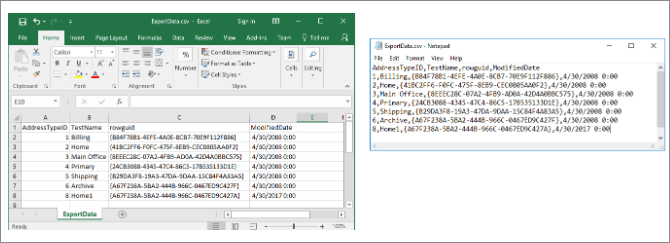
Reports that include row groups or column groups contain empty cells when exported to Excel. Imagine a report that groups rows on commute distance. Each commute distance can contain more than one customer. The following picture shows the report.

When the report is exported to Excel, the commute distance appears only in one cell of the Commute Distance column. Depending on the alignment of the text in the report (top, middle, or bottom) the value is in the first, middle, or last cell. The other cells are empty. The Name column that contains customer names has no empty cells. The following picture shows the report after it is exported to Excel. The red cell borders were added for emphasis. The gray boxes are the empty cells. (Neither the red lines nor the gray boxes are part of the exported report.)

Reports with row groups or column groups require modification after exporting to Excel and before you can display the exported data in a PivotTable. You must add the group value to cells in which they are missing. Thus, the worksheet becomes a flat table with values in all cells. The following picture shows the updated worksheet.

So if you create a report for the specific purpose of exporting it to Excel for further analysis of the report data, consider not grouping on rows or columns in your report.
Excel Renderer
Current (.xlsx) Excel File Renderer
In [!INCLUDEssNoVersion] [!INCLUDEssRSnoversion], the default Excel renderer is the version compatible with current (.xlsx) [!INCLUDEofprexcel] files. This is the Excel option on the Exporting menus in the [!INCLUDEssRSnoversion] web portal and SharePoint list.
When you use the default Excel renderer, instead of the earlier Excel 2003 (.xls) renderer, you can install the Microsoft Office Compatibility Pack for Word, Excel, and PowerPoint to allow earlier versions of Excel to open the files that are exported.
Excel 2003 (.xls) Renderer
[!IMPORTANT]
The [!INCLUDEofprexcel] 2003 rendering extension is deprecated. For more information, see Deprecated Features in SQL Server Reporting Services in SQL Server 2016.
The earlier version of the Excel renderer, compatible with Excel 2003, is now named Excel 2003 and is listed on menus using that name. The content type of files generated by this renderer is application/vnd.ms-excel and the file name extension of files is .xls.
By default, the Excel 2003 menu option is not visible. An administrator can make it visible under certain circumstances by updating the RSReportServer configuration file. To export reports from [!INCLUDEssBIDevStudioFull] using the Excel 2003 renderer, you update the RSReportDesigner configuration file.
The Excel 2003 menu option extension is never visible in the following scenarios:
-
Report Builder in disconnected mode and you preview a report in Report Builder. Because the RSReportServer configuration file resides on the report server, the tools or products from where you export reports must be connected to a report server to read the configuration file.
-
Report Viewer Web Part in local mode and the SharePoint farm is not integrated with a [!INCLUDEssRSnoversion] report server. For more information, see Local Mode vs. Connected Mode Reports in the Report Viewer (Reporting Services in SharePoint Mode)
If the Excel 2003 menu option renderer is configured to be visible, both the Excel and Excel 2003 options are available in the following scenarios:
-
[!INCLUDEssRSnoversion] web portal native mode.
-
SharePoint site when Reporting Services is installed in SharePoint integrated mode.
-
[!INCLUDEssBIDevStudioFull] and you preview reports.
-
Report Builder connected to a report server.
-
The Report Viewer Web Part in remote mode.
The following XML shows the elements for the two Excel rendering extensions in the RSReportServer and RSReportDesigner configuration files:
<Extension Name="EXCELOPENXML" Type="Microsoft.ReportingServices.Rendering.ExcelOpenXmlRenderer.ExcelOpenXmlRenderer,Microsoft.ReportingServices.ExcelRendering"/>
<Extension Name="EXCEL" Type="Microsoft.ReportingServices.Rendering.ExcelRenderer.ExcelRenderer,Microsoft.ReportingServices.ExcelRendering" Visible="false"/>
The EXCELOPENXML extension defines the Excel renderer for current (.xlsx) Excel files. The EXCEL extension defines the Excel 2003 version. Visible = "false" indicates the Excel 2003 renderer is hidden. For more information, see RsReportServer.config Configuration File and RSReportDesigner Configuration File.
Differences Between the current (.xlsx) Excel and Excel 2003 Renderers
Reports, rendered by using the current (.xlsx) Excel or the Excel 2003 renderers are typically identical and only under rare circumstances will you notice differences between the two formats. The following table compares the Excel and the Excel 2003 renderers.
| Property | Excel 2003 | Current Excel |
|---|---|---|
| Maximum columns per worksheet | 256 | 16,384 |
| Maximum rows per worksheet | 65,536 | 1,048,576 |
| Number of colors allowed in a worksheet | 56 (palette)
If more than 56 colors are used in the report, the rendering extension matches the required color to one of the 56 colors already available in the custom palette. |
Approximately 16 million (24-bit color) |
| ZIP compressed files | None | ZIP compression |
| Default font family | Arial | Calibri |
| Default font size | 10pt | 11pt |
| Default row height | 12.75 pt | 15 pt |
Because the report explicitly sets the row height, the default row height affects only rows that are sized automatically upon export to Excel.
Report Items in Excel
Rectangles, subreports, the report body, and data regions are rendered as a range of Excel cells. Text boxes, images, and charts, data bars, sparklines, maps, gauges, and indicators must be rendered within one Excel cell, which might be merged depending on the layout of the rest of the report.
Images, charts, sparklines, data bars, maps, gauges, indicators, and lines are positioned within one Excel cell but they sit on top of the cell grid. Lines are rendered as cell borders.
Charts, sparklines, data bars, maps, gauges, and indicators are exported as pictures. The data they depict, such as the value and member labels for a chart, is not exported with them and is not available in the Excel workbook unless it is included in a column or row in a data region within a report.
If you want to work with chart, sparkline, data bar, maps, gauge, and indicator data, export the report to a .csv file or generate Atom-compliant data feeds from the report. For more information, see Exporting to a CSV File (Report Builder and SSRS) and Generating Data Feeds from Reports (Report Builder and SSRS).
Page Sizing
The Excel rendering extension uses the page height and width settings to determine what paper setting to define in the Excel worksheet. Excel tries to match the PageHeight and PageWidth property settings to one of the most common paper sizes.
If no matches are found, Excel uses the default page size for the printer. Orientation is set to Portrait if the page width is less than the page height; otherwise, orientation is set to Landscape.
Worksheet Tab Names
When you export a report to Excel, the report pages that were created by page breaks are exported to different worksheets. If you provided an initial page name for the report, each worksheet of the Excel workbook will have this name by default. The name appears on the worksheet tab. However, since each worksheet in a workbook must have a unique name, an integer starting at 1 and incremented by 1 is appended to the initial page name for each additional worksheet. For example, if the initial page name is Sales Report by Fiscal Year, the second worksheet would be named Sales Report by Fiscal Year1, the third one Sales Report by Fiscal Year2, and so forth.
If all report pages created by page breaks provide new page names, each worksheet will have the associated page name. However, these page names might not be unique. If page names are not unique, the worksheets are named the same way as initial page names. For example, if the page name of two groups is Sales for NW, one worksheet tab will have the name Sales for NW, and the other Sales for NW1.
If the report provides neither an initial page name, nor page names related to page breaks, the worksheet tabs will have the default names Sheet1, Sheet2, and so forth.
Reporting Services provides properties to set on reports, data regions, groups, and rectangles to help you create reports that can be exported to Excel in a way that you want. For more information, see Pagination in Reporting Services (Report Builder and SSRS).
Document Properties
The Excel renderer writes the following metadata to the Excel file.
| Report Element properties | Description |
|---|---|
| Created | Date and time of report execution as an ISO date/time value. |
| Author | Report.Author |
| Description | Report.Description |
| LastSaved | Date and time of report execution as an ISO date/time value. |
Page Headers and Footers
Depending on the Device Information SimplePageHeaders setting, the page header can be rendered in two ways: the page header can be rendered at the top of each worksheet cell grid, or in the actual Excel worksheet header section. By default, the header is rendered to the cell grid on the Excel worksheet.
The page footer is always rendered to the actual Excel worksheet footer section, regardless of the value of the SimplePageHeaders setting.
Excel header and footer sections support a maximum of 256 characters, including markup. If this limit is exceeded, the Excel renderer removes markup characters starting at the end of the header and/or footer string to reduce the number of total characters. If all markup characters are removed and the length still exceeds the maximum, the string is truncated starting from the right.
SimplePageHeader Settings
By default, the Device Information SimplePageHeaders setting is set to False; therefore, the page headers are rendered as rows in the report on the Excel worksheet surface. The worksheet rows that contain the headers become locked rows. You can freeze or unfreeze the pane in Excel. If the Print Titles option is selected, these headers are automatically set to print on every worksheet page.
The page header repeats at the top of every worksheet in the workbook except the document map cover sheet if the Print Titles option is selected on the Page Layout tab in Excel. If the Print on first page or the Print on last page option is not selected in the Report Header Properties or Report Footer Properties dialog boxes, the header will not be added to the first or last page respectively.
Page footers are rendered in the Excel footer section.
Because of Excel limitations, text boxes are the only type of report item that can be rendered in the Excel header/footer section.
Interactivity
Some interactive elements are supported in Excel. The following is a description of specific behaviors.
Show and Hide
[!INCLUDEofprexcel] has limitations with how it manages hidden and displayed report items when they are exported. Groups, rows, and columns that contain report items that can be toggled are rendered as Excel outlines. Excel creates outlines that expand and collapse rows and columns across the entire row or column which can cause the collapse of report items that are not intended to be collapsed. In addition, Excel’s outlining symbols can become cluttered with overlapping outlines. To address these issues, the following outlining rules are applied when using the Excel rendering extension:
-
The report item in the top-left corner that can be toggled can continue to be toggled in Excel. Report items that can be toggled and share vertical or horizontal space with the report item that can be toggled in the top-left corner cannot be toggled in Excel.
-
To determine whether a data region will be collapsible by rows or columns, the position of the report item that controls the toggling and the position of the report item that is toggled are determined. If the item controlling the toggling appears before the item to be toggled, the item is collapsible by rows. Otherwise, the item is collapsible by columns. If the item controlling the toggling appears beside and above the area to be toggled equally, the item is rendered with row collapsible by rows.
-
To determine where the subtotals are placed in the rendered report, the rendering extension examines the first instance of a dynamic member. If a peer static member appears immediately above it, the dynamic member is assumed to be the subtotals. Outlines are set to indicate that this is summary data. If there are no static siblings of a dynamic member, the first instance of the instance is the subtotal.
-
Due to an Excel limitation, outlines can be nested up to 7 levels only.
Document Map
If any document map labels exist in the report, a document map is rendered. The document map is rendered as an Excel cover worksheet inserted at the first tab position in the workbook. The worksheet is named Document map.
The text displayed in the document map is determined by the report item’s or group’s DocumentMapLabel property. Document map labels are listed in the order that they appear in the report, starting at the first row, in the first column. Each document map label cell is indented the number of levels deep it appears in the report. Each level of indentation is represented by placing the label in a subsequent column. Excel supports up to 256 levels of outline nesting.
The document map outline is rendered as a collapsible Excel outline. The outline structure matches the nested structure of the document map. The expand and collapse state of the outline starts at the second level.
The root node of the map is the report name, the <reportname>.rdl, and it is not interactive. The document map links font is Arial, 10pt.
Drillthrough Links
Drillthrough links that appear in text boxes are rendered as Excel hyperlinks in the cell in which the text is rendered. Drillthrough links for images and charts are rendered as Excel hyperlinks on the image when rendered. When clicked, the drillthrough link opens the client’s default browser and navigates to the HTML view of the target.
Hyperlinks
Hyperlinks that appear in text boxes are rendered as Excel hyperlinks in the cell in which the text is rendered. Hyperlinks for images and charts are rendered as Excel hyperlinks on the image when rendered. When clicked, the hyperlink opens the client’s default browser and navigates to the target URL.
Interactive Sorting
Excel does not support interactive sort.
Bookmarks
Bookmark links in text boxes are rendered as Excel hyperlinks in the cell in which the text is rendered. Bookmark links for images and charts are rendered as Excel hyperlinks on the image when rendered. When clicked, the bookmark goes to the Excel cell in which the bookmarked report item is rendered.
Changing Reports at Run-Time
If a report must render to multiple formats and it is not possible to create a report layout that renders the way you want in all required formats, then you might consider using the value in the RenderFormat built-in global to conditionally change the report appearance at run time. This way you can hide or show report items depending on the renderer used to get the best results in each format. For more information, see Built-in Globals and Users References (Report Builder and SSRS).
Troubleshoot export to Excel
Export to Excel or Word fails when using Virtual Service Account and Execution Account
The workaround for this issue is to give Read permission to the Execution account for the described registry entry under the Virtual User Account branch, and restart the computer. For example, one possible registry entry is HKEY_USERSS-1-5-80-4050220999-2730734961-1537482082-519850261-379003301SoftwareMicrosoftAvalon.Graphics.
See Also
Pagination in Reporting Services (Report Builder and SSRS)
Rendering Behaviors (Report Builder and SSRS)
Interactive Functionality for Different Report Rendering Extensions (Report Builder and SSRS)
Rendering Report Items (Report Builder and SSRS)
Tables, Matrices, and Lists (Report Builder and SSRS)
There are several ways to Export/Import SQL Server data to an Excel file. In this article, a couple of ways to import and export SQL Server data to an Excel file will be explained:
- Export SQL Server data to an Excel file using
- the SQL Server Import and Export Wizard
- T-SQL code
- Export to Excel from ApexSQL Complete
- Import SQL Server data into Excel using the Data Connection Wizard
In SQL Server Management Studio (SSMS), there is a feature that provides for exporting data from one data source to another data source; in this case, data from SQL Server will be copied to an Excel file trough Export Wizard.
To start to use this feature, go to Object Explorer, right click on any database (e.g. AdventureworksDW2016CTP3), under the Tasks, choose Export Data command:
This will open the SQL Server Import and Export Wizard window:
To proceed with exporting SQL Server data to an Excel file, click the Next button. This will open the Choose a Data Source window. On this window, a source from which you want to copy data can be chosen:
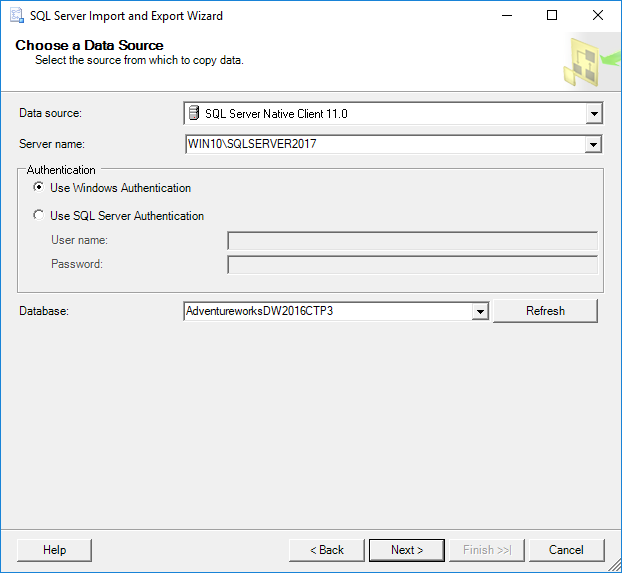
From the Data source drop down box, choose the SQL Server Native Client 11.0 item. Under the Server name drop down box, choose the SQL Server instance from which data need to be copied. In the Authentication section, choose the authentication mode for the data source connection and under the Database drop down box, choose the database from which the data will be copied. After all these options are set, click the Next button to proceed.
This will open the Choose a Destination window in which can be specified where to copy data from the data source:
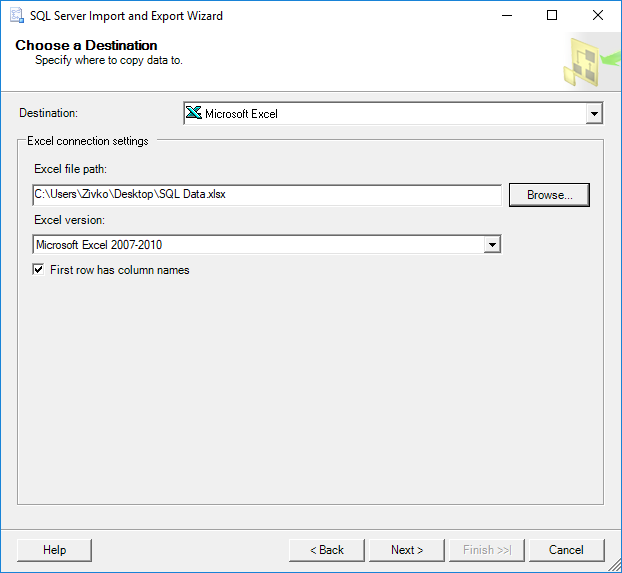
In the Destination drop down box, choose the Microsoft Excel item. Under the Excel file path, choose the destination for copied data from SQL Server data source (SQL Data.xlsx). In the Excel version drop down box, choose the version of the Microsoft Excel worksheet. After these are all set, press the Next button to continue. But after pressing the Next button, the following warning message may appear:
The operation could not be completed.
ADDITIONAL INFORMATION:
The ‘Microsoft.ACE.OLEDB.12.0’ provider is not registered on the local machine. (System.Data)
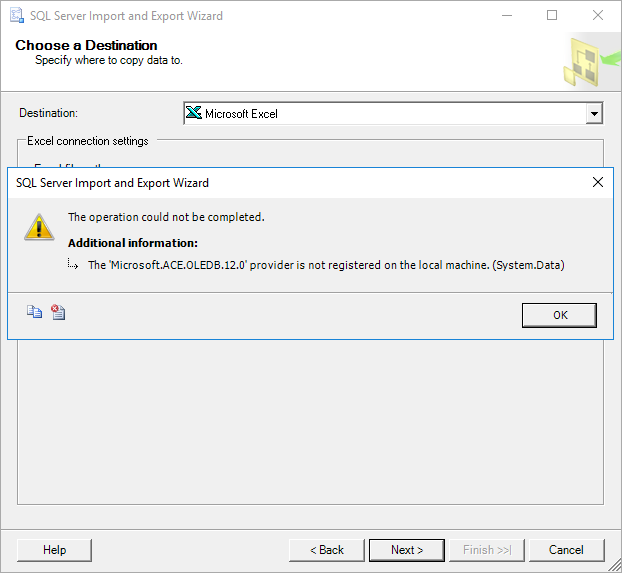
This happens because SSMS is a 32-bit application and when you launch the Export Wizard via SSMS, it launches a 32-bit version of Export Wizard. On the other hand, the machine (Operating system) on which SSMS is installed is a 64-bit version and the installed SQL Server is a 64-bit version.
To solve this problem, close SSMS, go to the Start menu and find the 64-bit version of SQL Server Import and Export Data:
After launching this SQL Server Import and Export Wizard, it will be prompted with the same window that is used via SSMS. After setting all previous options, click the Next button. The Specify Table Copy or Query window will appear:
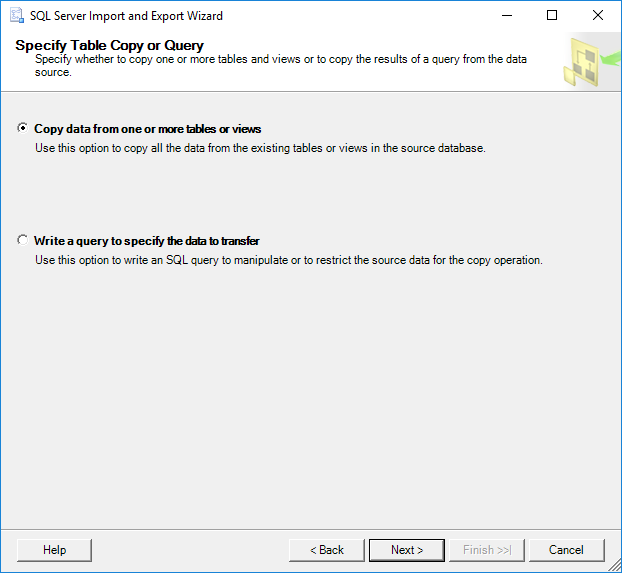
On this window, whether to copy data from one or more tables and views or to copy the results of a query can be specified.
Select the Copy data from one or more tables or views radio button and click the Next button. The Select Source Table and Views window allows choosing one or more tables and views from which you want to export SQL Server data to an Excel file by clicking the check box next to the name of the table/view:
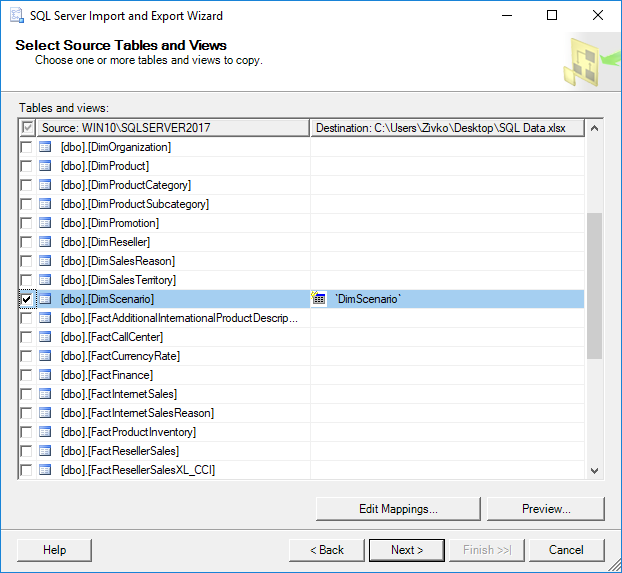
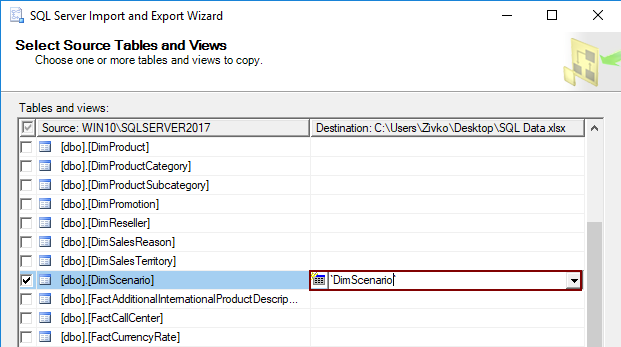
As it may be noticed, as soon as the check box next to a table/view is checked, the name of the table/view will be copied under the Destination column. This name represents the name of the sheet where the data from the table will be put, this name can be changed to whatever you like, but for now, it will be left as it is:
To preview which data will be generated to an Excel file, click the Preview button:
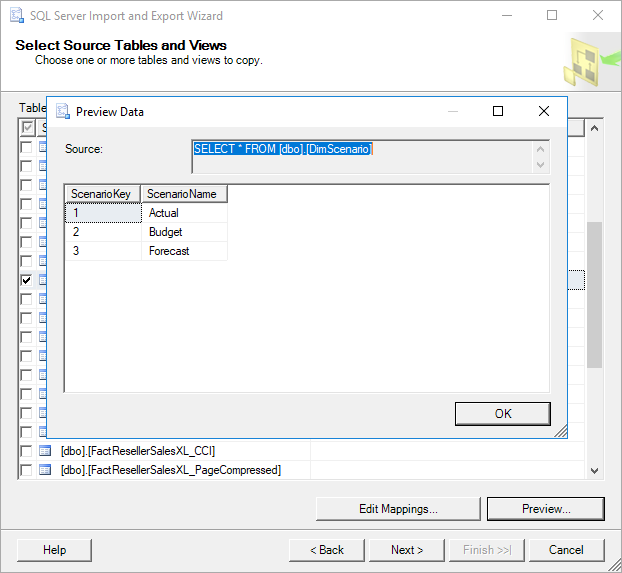
After choosing which tables/views data will be copied to an Excel file, click the Next button:
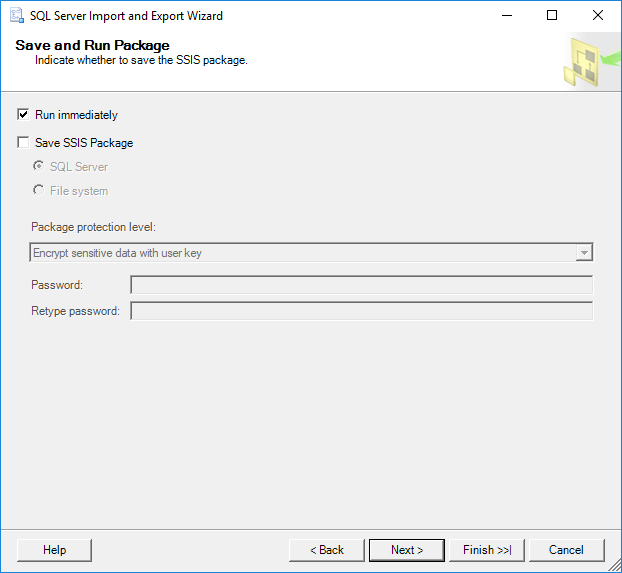
On the Save as Run Package window, check the Run immediately check box and click the Next button:
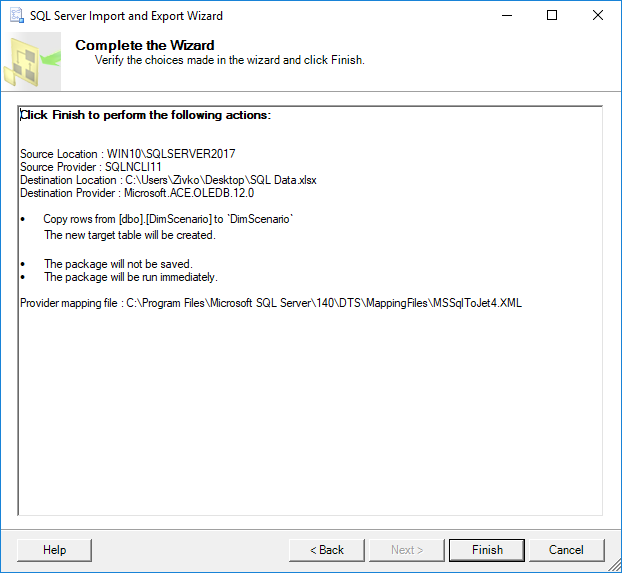
The Complete the Wizard window shows all options that are chosen for exporting operations. To finalize the process of export SQL Server data to an Excel file, click the Finish button. The last SQL Server Import and Export Wizard window shows the state of the data have been successfully exported or some errors occurred during exporting data:
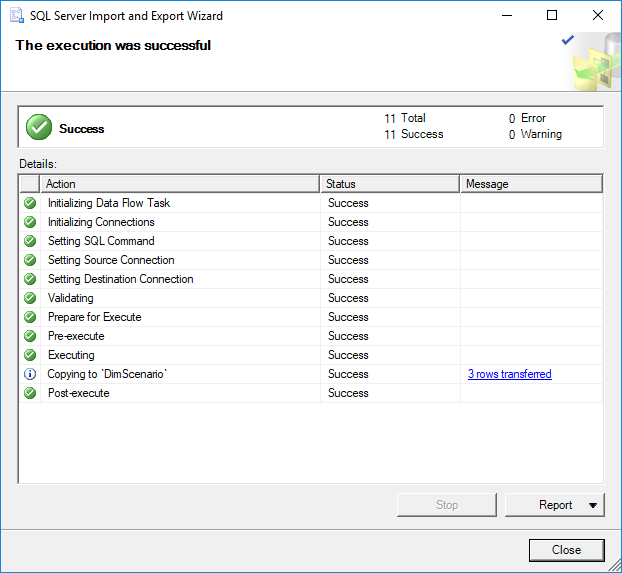
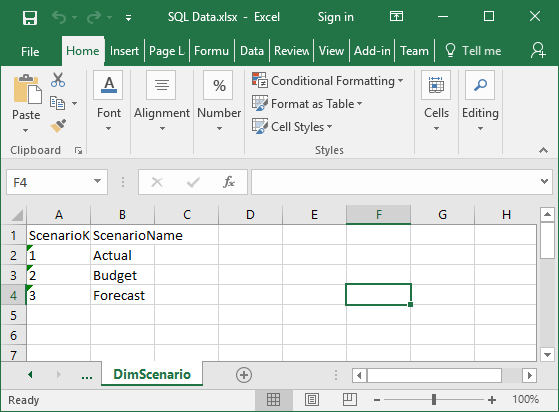
In our case, the data were successfully generated into the SQL Data.xlsx file in the DimScenario sheet:
Export SQL Server data to an Excel file using T-SQL code
The Transact-SQL OPENROWSET can be used to export SQL Server data to an Excel file via SSMS. In a query editor type and execute the following code:
INSERT INTO OPENROWSET('Microsoft.ACE.OLEDB.12.0','Excel 12.0;
Database=C:UsersZivkoDesktopSQL Data.xlsx;','SELECT * FROM [Sheet1$]')
SELECT * FROM dbo.DimScenario
But, when executing the above code, the following error may occur:
Msg 15281, Level 16, State 1, Line 1
SQL Server blocked access to STATEMENT ‘OpenRowset/OpenDatasource’ of component ‘Ad Hoc Distributed Queries’ because this component is turned off as part of the security configuration for this server. A system administrator can enable the use of ‘Ad Hoc Distributed Queries’ by using sp_configure. For more information about enabling ‘Ad Hoc Distributed Queries’, search for ‘Ad Hoc Distributed Queries’ in SQL Server Books Online.
To resolve this error the Ad Hoc Distributed Queries option should be enabled This can be done by using the sp_configure procedure and executing the following SQL code in a query editor:
EXEC sp_configure 'show advanced options', 1
RECONFIGURE
EXEC sp_configure 'Ad Hoc Distributed Queries', 1
RECONFIGURE
After executing the above code, the following message will appear that indicate that the show advanced options and Ad Hoc Distributed Queries options are enabled:
Configuration option ‘show advanced options’ changed from 0 to 1. Run the RECONFIGURE statement to install.
Configuration option ‘Ad Hoc Distributed Queries’ changed from 0 to 1. Run the RECONFIGURE statement to install.
Now, when again the code is executed:
INSERT INTO OPENROWSET('Microsoft.ACE.OLEDB.12.0','Excel 12.0;
Database=C:UsersZivkoDesktopSQL Data.xlsx;','SELECT * FROM [Sheet1$]')
SELECT * FROM dbo.DimScenario
The following error may appear:
OLE DB provider “Microsoft.ACE.OLEDB.12.0” for linked server “(null)” returned message “The Microsoft Access database engine cannot open or write to the file ”. It is already opened exclusively by another user, or you need permission to view and write its data.”.
Msg 7303, Level 16, State 1, Line 1
Cannot initialize the data source object of OLE DB provider “Microsoft.ACE.OLEDB.12.0” for linked server “(null)
This usually happens because of inadequate permissions.
More about how to resolving these issues can be found in the How to query Excel data using SQL Server linked servers page.
One way for resolving this issue is to open SSMS as an administrator and execute the code again. But this time, another error may appear:
Msg 213, Level 16, State 1, Line 1
Column name or number of supplied values does not match table definition.
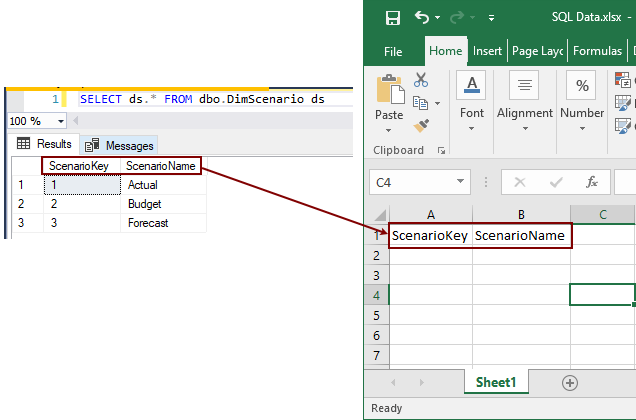
To resolved this, open excel file (e.g. SQL Data.xlsx) for which is planned to store the data from SQL Server table (e.g. dbo.DimScenario) and enter the column names which will represent the column names from the DimScenario table:
Close the SQL Data.xlsx file and once again execute the code:
Now, the following message will appear:
(3 rows affected)
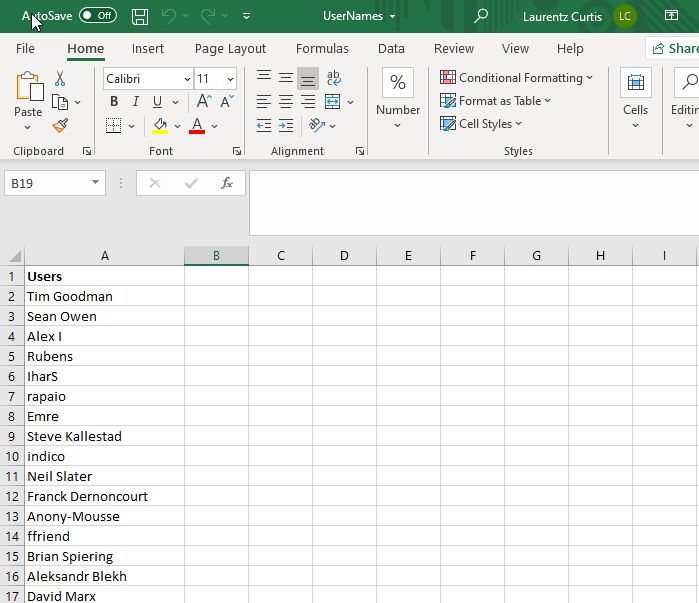
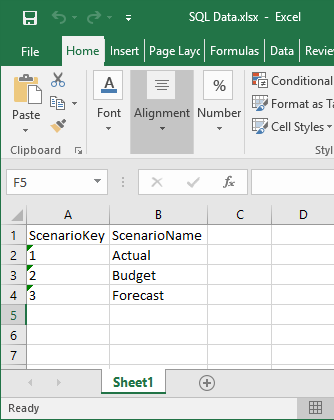
Finally, the data from the SQL Server table are copied into the Excel file:
Import SQL Server data into Excel using the Data Connection Wizard dialog
Another way to copy data from SQL Server table to an Excel file is to use the Data Connection Wizard dialog from Excel.
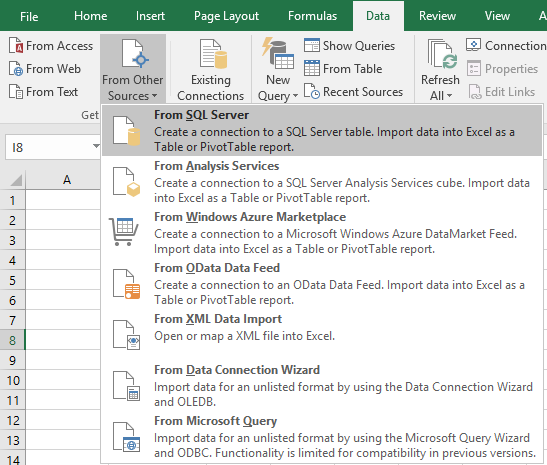
In order to achieve that, open an Excel file (e.g. SQL Data.xlsx) in which you want to import data. In the Data tab, under the From Other Source sub-menu, choose the From SQL Server command:
This will open the Data Connection Wizard dialog. In the Server name, enter a name of the SQL Server instance from which data need to be copied. In the Log on credentials section, choose the authentication mode for the data source connection and click the Next button:

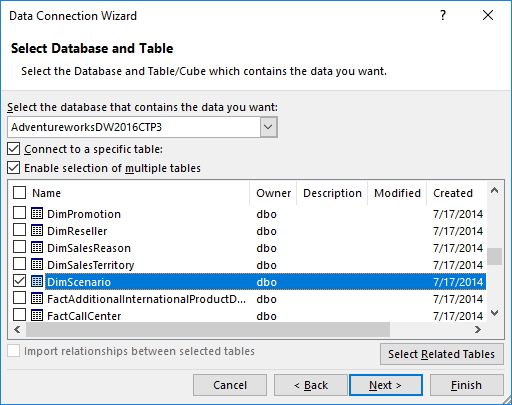
From the Select the database that contains the data you want drop down box, choose the database from which the data will be copied. In the grid, all available tables and views will be listed. Choose a desired table / view (e.g. DimScenario) and click the Next button to proceed.
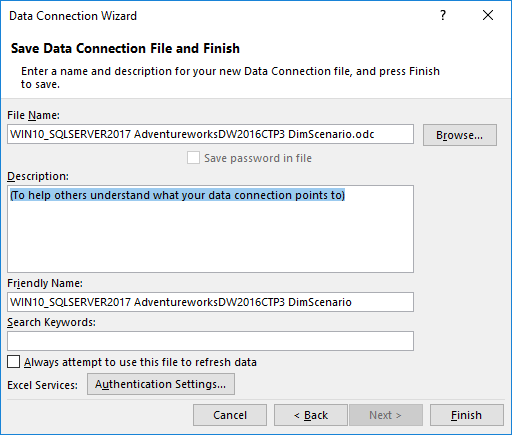
On this window, leave everything as it is and press the Finish button:
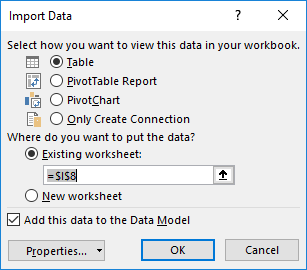
In the Import Data dialog, choose the Table radio button, under the Where do you want to put the data? section, choose the Existing worksheet radio button and press the OK button:
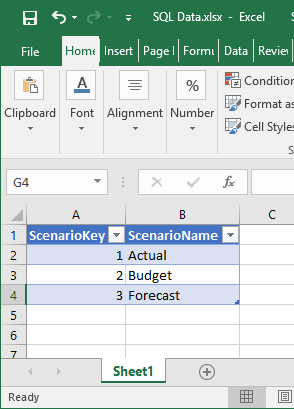
After pressing the OK button, the data from the DimScenario table will be copied to the SQL Data.xslx file:
Export SQL Server data to an Excel file using Export to Excel from ApexSQL Complete
Using the Export to Excel feature from ApexSQL Complete, add-in for SSMS and Visual Studio, exporting data from the SQL Server table to an Excel file can be done by one click.
In a query editor, type and execute the following code:
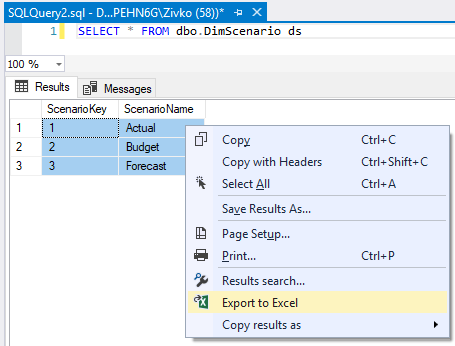
SELECT * FROM dbo.DimScenario ds
From the Results grid, select data that you want to export to an Excel file, right click in the Result grid and, from the context menu, choose the Export to Excel option:
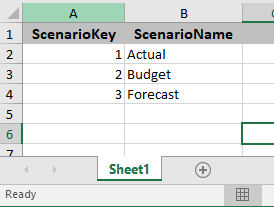
This will open a new Excel workbook and the selected data from the Results grid will be copied in the first worksheet:
More about exporting to Excel via ApexSQL Complete can be found on the Export to Excel page.
See also:
- Tutorial: Import Data into Excel, and Create a Data Model
- Get started with this simple example of the Import and Export Wizard
- How to query Excel data using SQL Server linked servers
- Export to Excel
September 11, 2017
Время на прочтение
4 мин
Количество просмотров 54K

Приветствую всех.
При автоматизации небольших магазинов для хранения данных часто используют PostgreSQL. И часто возникает потребность экспортировать эти данные в Excel. В этой статье я расскажу вам как я решал эту задачу. Естественно, матерые специалисты вряд ли откроют для себя что-то новое. Однако, материал будет интересен тем кто «плавает» в этой теме.
Итак, естественно, самый просто и банальный способ экспортировать данные результатов запросов в csv-файлы, а затем открыть их в Excel. Это выглядит вот так:
COPY (SELECT * FROM your_table) TO 'C:/temp/123.csv' CSV;
Однажды, ко мне обратился товарищ, которому нужно было получать различные данные из PostgreSQL. Причем, запросы на предоставление данных менялись день ото дня. Казалось бы первым способом можно было бы спокойно пользоваться, но в нем есть существенные недостатки:
- во-первых, вставка данных из PostgreSQL происходит именно на сервере;
- во-вторых, можно конечно заморочиться написать batch-скрипт, который будет удаленно вызывать этот запрос на сервере, затем этот файл скопировать на компьютер пользователя и инициировать открытие в Excel.
Но я захотел ускорить процесс как можно быстрее, и я нашел способ.
Шаги:
1. Идем по ссылке и в зависимости от разрядности компьютера скачиваем установщик ODBC драйвера. Установка его проста и не требует особых знаний.
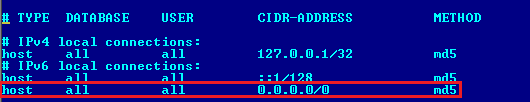
2. Чтобы пользователи могли со своих компьютеров цепляться к БД не забудьте в файле pg_hba.conf установить параметры для IP-адресов, с которых можно производить подключения:

В данном примере, что все рабочие станции смогут подключаться к серверу с БД:
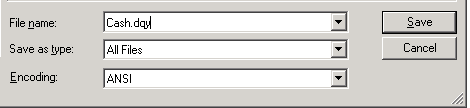
3. Далее через Excel просто генерируем файл динамического запроса к данным *.dqy. Далее этот файл просто можно менять по своему усмотрению. Можно прям ниже следующий текст взять, скопировать в блокнот и там отредактировать, сохранив файл *.dqy. Вводим имя файла и расширение dqy. Выбираем типа файла ВСЕ(All files):
XLODBC
1
DRIVER={PostgreSQL Unicode};DATABASE=your_base;SERVER=192.168.12.12;PORT=5432;UID=postgres;PASSWORD=postgres;SSLmode=disable;ReadOnly=0;Protocol=7.4;FakeOidIndex=0;ShowOidColumn=0;RowVersioning=0;ShowSystemTables=0;ConnSettings=;Fetch=100;Socket=4096;UnknownSizes=0;MaxVarcharSize=255;MaxLongVarcharSize=8190;Debug=0;CommLog=0;Optimizer=0;Ksqo=1;UseDeclareFetch=0;TextAsLongVarchar=1;UnknownsAsLongVarchar=0;BoolsAsChar=1;Parse=0;CancelAsFreeStmt=0;ExtraSysTablePrefixes=dd_;LFConversion=1;UpdatableCursors=1;DisallowPremature=0;TrueIsMinus1=0;BI=0;ByteaAsLongVarBinary=0;UseServerSidePrepare=0;LowerCaseIdentifier=0;GssAuthUseGSS=0;XaOpt=1
select * from your_table
DATABASE – указывается наименование БД к которой будет производиться подключение;
SERVER – адрес сервера;
PASSWORD – пароль на подключение к БД.
Обратите внимание, что в большом тексте указываются параметры подключения к БД и ваша БД. Также можно еще сконфигурировать множество параметров подключения
В последней строке пишется сам запрос. Далее сохраняем файл. Если на компьютере установлен Microsoft Excel, тогда файл сразу же приобретет пиктограмму:

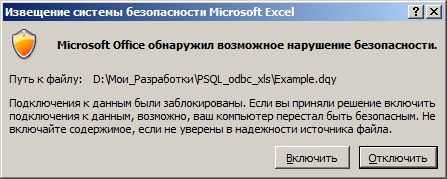
При запуске файла будет выдано диалоговое окно. Смело нажимаем «Включить»:
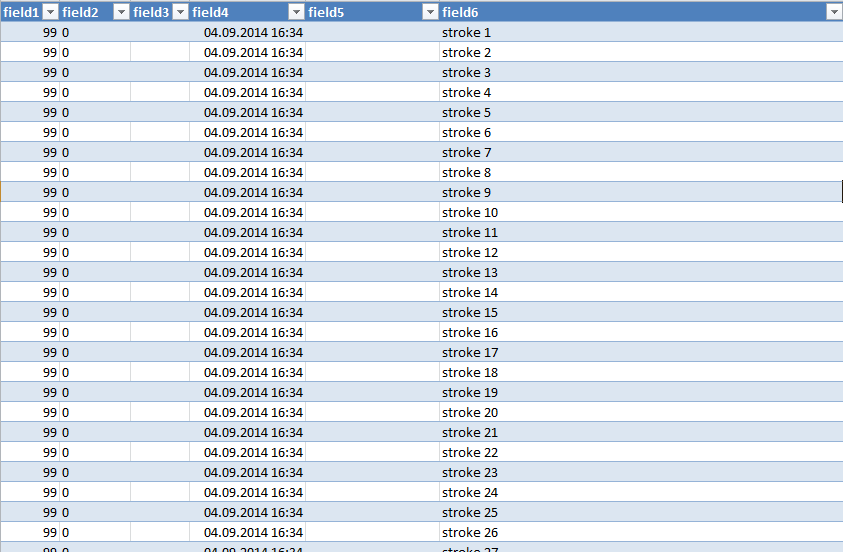
И получаем результат запроса из БД:
Теперь можно создать несколько таких файлов и спокойно скопировать их на рабочий стол пользователя:

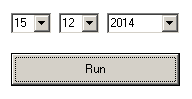
Кстати, я пошел немного дальше. Откопал старый добрый VB6. Можно так сделать с любым языком программирования. Сделал форму, которая по выбранной дате запрашивает данные из БД, путем генерации этого *.dqy файла:
Затем немного покодил (вот часть кода):
sq1 = "your_query"

   Open "report.dqy" For Output As #1
   Print #1, "XLODBC"
   Print #1, "1"
   Print #1, "DRIVER={PostgreSQL Unicode};DATABASE=your_db;SERVER=192.168.12.12;PORT=5432;UID=postgres;PASSWORD=postgres;SSLmode=disable;ReadOnly=0;Protocol=7.4;FakeOidIndex=0;ShowOidColumn=0;RowVersioning=0;ShowSystemTables=0;ConnSettings=;Fetch=100;Socket=4096;UnknownSizes=0;MaxVarcharSize=255;MaxLongVarcharSize=8190;Debug=0;CommLog=0;Optimizer=0;Ksqo=1;UseDeclareFetch=0;TextAsLongVarchar=1;UnknownsAsLongVarchar=0;BoolsAsChar=1;Parse=0;CancelAsFreeStmt=0;ExtraSysTablePrefixes=dd_;LFConversion=1;UpdatableCursors=1;DisallowPremature=0;TrueIsMinus1=0;BI=0;ByteaAsLongVarBinary=0;UseServerSidePrepare=0;LowerCaseIdentifier=0;GssAuthUseGSS=0;XaOpt=1"
   Print #1, sq1
   Close #1
   Shell "CMD /c report.dqy"
Результат получился тот же — данные из Excel, и пользователю удобно. Да, кстати, в строке:
DRIVER={PostgreSQL Unicode};
если речь идет о 64-битном процессоре и драйвере ODBC, установленном для 64 бит, то надо писать:
DRIVER={PostgreSQL Unicode(x64)};
Ну, и самое главное, несмотря на всю простоту способа, у него есть конечно недостатки: запрос можно писать только в одну строку, т.е. записать строку вот в таком виде не получиться. Нужно только в одну:
SELECT * FROM
un_cg_product
— Не сможет обрабатывать на изменение данных типа:
UPDATE
или
INSERT
Ну и может выводить только результат запроса в виде списка, т.е. красивый документ сделать не получиться. На этом все. Надеюсь данный способ кому-нибудь пригодиться. Буду рад получить ваши рекомендации по усовершенствованию моего метода или альтернативного решения данной проблемы.